Korean vs Immigrants from Zaire Single Male Poverty
COMPARE
Korean
Immigrants from Zaire
Single Male Poverty
Single Male Poverty Comparison
Koreans
Immigrants from Zaire
11.0%
SINGLE MALE POVERTY
100.0/ 100
METRIC RATING
15th/ 347
METRIC RANK
13.6%
SINGLE MALE POVERTY
0.9/ 100
METRIC RATING
251st/ 347
METRIC RANK
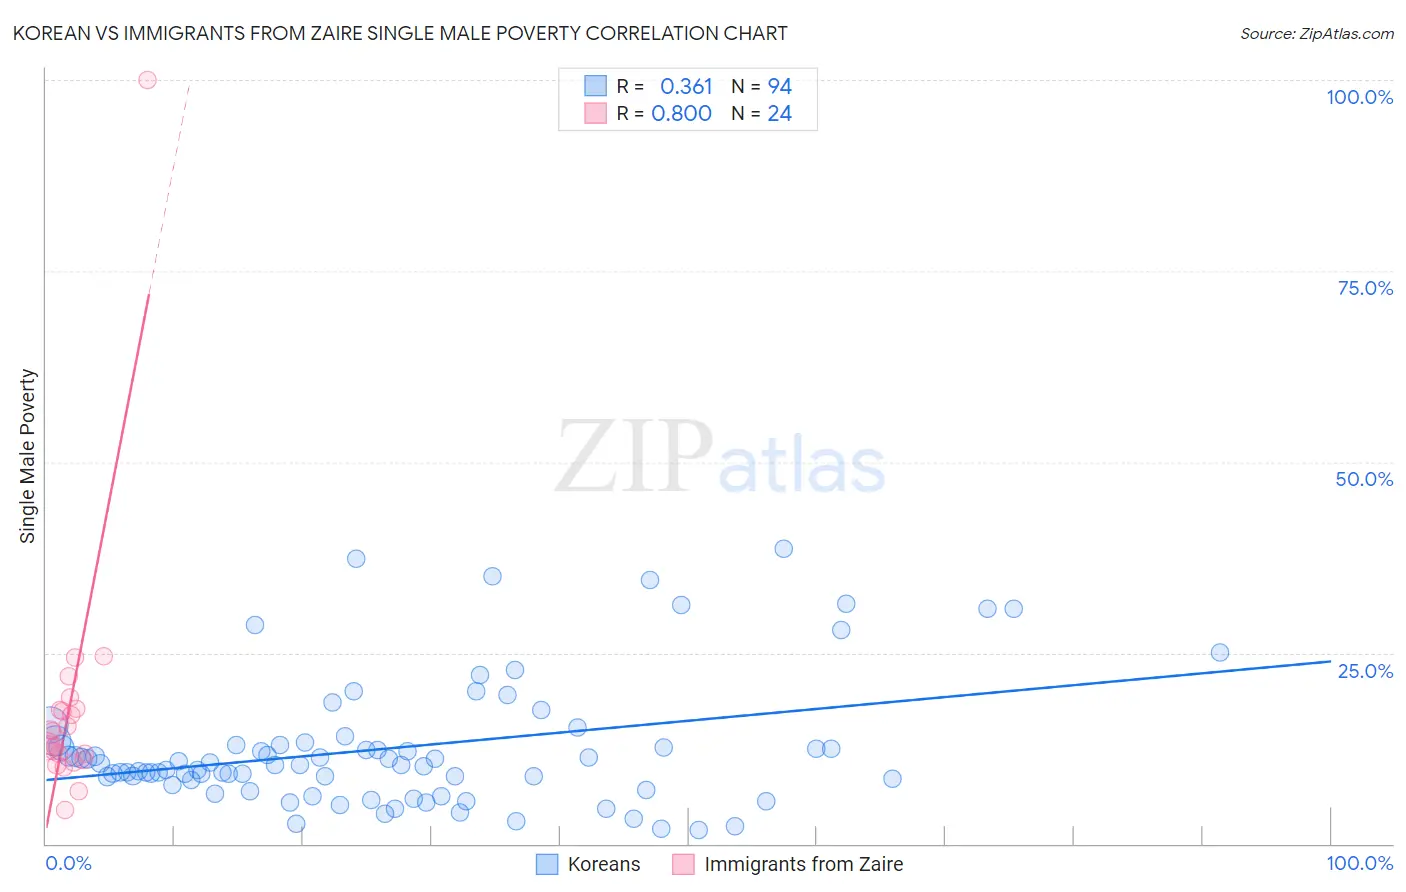
Korean vs Immigrants from Zaire Single Male Poverty Correlation Chart
The statistical analysis conducted on geographies consisting of 437,940,785 people shows a mild positive correlation between the proportion of Koreans and poverty level among single males in the United States with a correlation coefficient (R) of 0.361 and weighted average of 11.0%. Similarly, the statistical analysis conducted on geographies consisting of 103,503,403 people shows a strong positive correlation between the proportion of Immigrants from Zaire and poverty level among single males in the United States with a correlation coefficient (R) of 0.800 and weighted average of 13.6%, a difference of 23.7%.
Single Male Poverty Correlation Summary
| Measurement | Korean | Immigrants from Zaire |
| Minimum | 1.9% | 4.4% |
| Maximum | 38.6% | 100.0% |
| Range | 36.8% | 95.6% |
| Mean | 12.5% | 18.0% |
| Median | 10.3% | 13.8% |
| Interquartile 25% (IQ1) | 8.4% | 11.3% |
| Interquartile 75% (IQ3) | 13.0% | 17.6% |
| Interquartile Range (IQR) | 4.6% | 6.2% |
| Standard Deviation (Sample) | 8.3% | 18.2% |
| Standard Deviation (Population) | 8.3% | 17.8% |
Similar Demographics by Single Male Poverty
Demographics Similar to Koreans by Single Male Poverty
In terms of single male poverty, the demographic groups most similar to Koreans are Chinese (11.0%, a difference of 0.050%), Immigrants from South Central Asia (10.9%, a difference of 0.62%), Immigrants from Afghanistan (10.9%, a difference of 0.74%), Bhutanese (11.1%, a difference of 0.75%), and Immigrants from Philippines (10.9%, a difference of 0.82%).
| Demographics | Rating | Rank | Single Male Poverty |
| Thais | 100.0 /100 | #8 | Exceptional 10.8% |
| Taiwanese | 100.0 /100 | #9 | Exceptional 10.9% |
| Immigrants | Fiji | 100.0 /100 | #10 | Exceptional 10.9% |
| Immigrants | Philippines | 100.0 /100 | #11 | Exceptional 10.9% |
| Immigrants | Afghanistan | 100.0 /100 | #12 | Exceptional 10.9% |
| Immigrants | South Central Asia | 100.0 /100 | #13 | Exceptional 10.9% |
| Chinese | 100.0 /100 | #14 | Exceptional 11.0% |
| Koreans | 100.0 /100 | #15 | Exceptional 11.0% |
| Bhutanese | 100.0 /100 | #16 | Exceptional 11.1% |
| Tsimshian | 100.0 /100 | #17 | Exceptional 11.1% |
| Immigrants | Bolivia | 100.0 /100 | #18 | Exceptional 11.1% |
| Immigrants | Moldova | 100.0 /100 | #19 | Exceptional 11.2% |
| Ethiopians | 100.0 /100 | #20 | Exceptional 11.2% |
| Asians | 100.0 /100 | #21 | Exceptional 11.2% |
| Immigrants | Pakistan | 100.0 /100 | #22 | Exceptional 11.2% |
Demographics Similar to Immigrants from Zaire by Single Male Poverty
In terms of single male poverty, the demographic groups most similar to Immigrants from Zaire are Finnish (13.6%, a difference of 0.050%), Immigrants from Somalia (13.6%, a difference of 0.11%), Spanish (13.6%, a difference of 0.13%), German Russian (13.6%, a difference of 0.19%), and Czech (13.5%, a difference of 0.37%).
| Demographics | Rating | Rank | Single Male Poverty |
| Immigrants | Senegal | 1.7 /100 | #244 | Tragic 13.5% |
| Immigrants | Latin America | 1.3 /100 | #245 | Tragic 13.5% |
| Immigrants | Micronesia | 1.2 /100 | #246 | Tragic 13.5% |
| Belgians | 1.2 /100 | #247 | Tragic 13.5% |
| Czechs | 1.2 /100 | #248 | Tragic 13.5% |
| Spanish | 1.0 /100 | #249 | Tragic 13.6% |
| Immigrants | Somalia | 1.0 /100 | #250 | Tragic 13.6% |
| Immigrants | Zaire | 0.9 /100 | #251 | Tragic 13.6% |
| Finns | 0.9 /100 | #252 | Tragic 13.6% |
| German Russians | 0.8 /100 | #253 | Tragic 13.6% |
| Sub-Saharan Africans | 0.5 /100 | #254 | Tragic 13.7% |
| Spaniards | 0.4 /100 | #255 | Tragic 13.7% |
| Immigrants | Belize | 0.4 /100 | #256 | Tragic 13.7% |
| Immigrants | Central America | 0.3 /100 | #257 | Tragic 13.8% |
| Immigrants | Guatemala | 0.3 /100 | #258 | Tragic 13.8% |