Kiowa vs Alaskan Athabascan Single Father Poverty
COMPARE
Kiowa
Alaskan Athabascan
Single Father Poverty
Single Father Poverty Comparison
Kiowa
Alaskan Athabascans
22.5%
SINGLE FATHER POVERTY
0.0/ 100
METRIC RATING
334th/ 347
METRIC RANK
18.1%
SINGLE FATHER POVERTY
0.0/ 100
METRIC RATING
291st/ 347
METRIC RANK
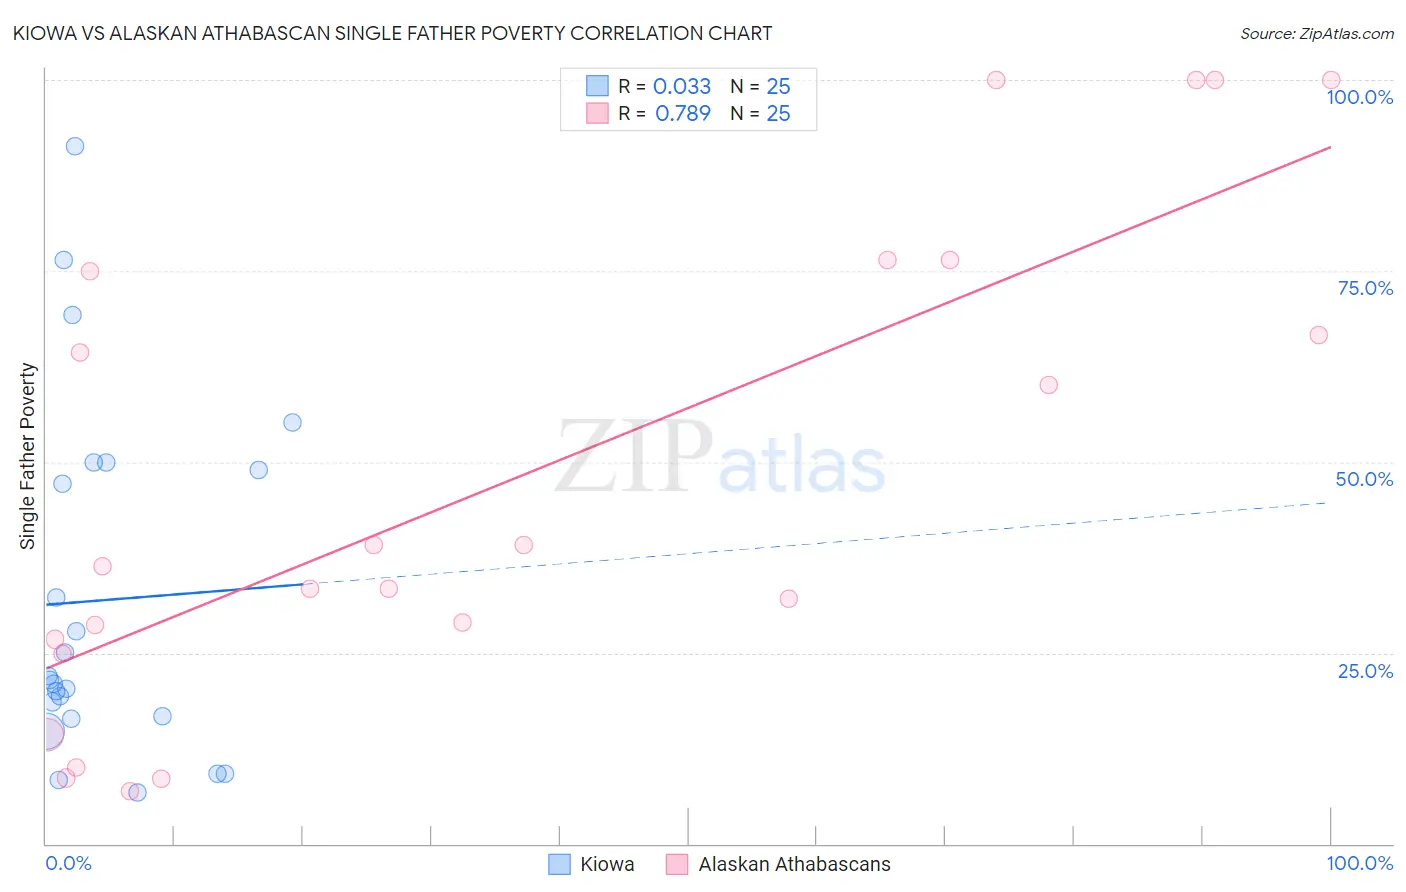
Kiowa vs Alaskan Athabascan Single Father Poverty Correlation Chart
The statistical analysis conducted on geographies consisting of 53,338,998 people shows no correlation between the proportion of Kiowa and poverty level among single fathers in the United States with a correlation coefficient (R) of 0.033 and weighted average of 22.5%. Similarly, the statistical analysis conducted on geographies consisting of 42,873,910 people shows a strong positive correlation between the proportion of Alaskan Athabascans and poverty level among single fathers in the United States with a correlation coefficient (R) of 0.789 and weighted average of 18.1%, a difference of 24.2%.
Single Father Poverty Correlation Summary
| Measurement | Kiowa | Alaskan Athabascan |
| Minimum | 6.7% | 6.9% |
| Maximum | 91.3% | 100.0% |
| Range | 84.6% | 93.1% |
| Mean | 31.9% | 47.6% |
| Median | 21.5% | 36.4% |
| Interquartile 25% (IQ1) | 16.5% | 25.8% |
| Interquartile 75% (IQ3) | 49.5% | 75.7% |
| Interquartile Range (IQR) | 33.0% | 49.9% |
| Standard Deviation (Sample) | 22.9% | 31.6% |
| Standard Deviation (Population) | 22.5% | 31.0% |
Similar Demographics by Single Father Poverty
Demographics Similar to Kiowa by Single Father Poverty
In terms of single father poverty, the demographic groups most similar to Kiowa are Native/Alaskan (22.4%, a difference of 0.36%), Shoshone (22.9%, a difference of 2.0%), Tohono O'odham (22.0%, a difference of 2.1%), Cajun (23.1%, a difference of 2.7%), and Central American Indian (21.7%, a difference of 3.6%).
| Demographics | Rating | Rank | Single Father Poverty |
| Choctaw | 0.0 /100 | #327 | Tragic 20.7% |
| Pueblo | 0.0 /100 | #328 | Tragic 21.1% |
| Colville | 0.0 /100 | #329 | Tragic 21.4% |
| Paiute | 0.0 /100 | #330 | Tragic 21.6% |
| Central American Indians | 0.0 /100 | #331 | Tragic 21.7% |
| Tohono O'odham | 0.0 /100 | #332 | Tragic 22.0% |
| Natives/Alaskans | 0.0 /100 | #333 | Tragic 22.4% |
| Kiowa | 0.0 /100 | #334 | Tragic 22.5% |
| Shoshone | 0.0 /100 | #335 | Tragic 22.9% |
| Cajuns | 0.0 /100 | #336 | Tragic 23.1% |
| Sioux | 0.0 /100 | #337 | Tragic 23.9% |
| Arapaho | 0.0 /100 | #338 | Tragic 24.0% |
| Apache | 0.0 /100 | #339 | Tragic 24.2% |
| Houma | 0.0 /100 | #340 | Tragic 26.7% |
| Hopi | 0.0 /100 | #341 | Tragic 27.2% |
Demographics Similar to Alaskan Athabascans by Single Father Poverty
In terms of single father poverty, the demographic groups most similar to Alaskan Athabascans are Immigrants from Bahamas (18.1%, a difference of 0.010%), Alaska Native (18.1%, a difference of 0.12%), U.S. Virgin Islander (18.1%, a difference of 0.14%), Yakama (18.1%, a difference of 0.20%), and West Indian (18.0%, a difference of 0.22%).
| Demographics | Rating | Rank | Single Father Poverty |
| Welsh | 0.0 /100 | #284 | Tragic 17.8% |
| Immigrants | Lebanon | 0.0 /100 | #285 | Tragic 17.9% |
| Immigrants | North Macedonia | 0.0 /100 | #286 | Tragic 17.9% |
| Carpatho Rusyns | 0.0 /100 | #287 | Tragic 18.0% |
| Bahamians | 0.0 /100 | #288 | Tragic 18.0% |
| Irish | 0.0 /100 | #289 | Tragic 18.0% |
| West Indians | 0.0 /100 | #290 | Tragic 18.0% |
| Alaskan Athabascans | 0.0 /100 | #291 | Tragic 18.1% |
| Immigrants | Bahamas | 0.0 /100 | #292 | Tragic 18.1% |
| Alaska Natives | 0.0 /100 | #293 | Tragic 18.1% |
| U.S. Virgin Islanders | 0.0 /100 | #294 | Tragic 18.1% |
| Yakama | 0.0 /100 | #295 | Tragic 18.1% |
| Seminole | 0.0 /100 | #296 | Tragic 18.1% |
| French | 0.0 /100 | #297 | Tragic 18.2% |
| Africans | 0.0 /100 | #298 | Tragic 18.3% |