Cherokee vs Alaskan Athabascan Single Father Poverty
COMPARE
Cherokee
Alaskan Athabascan
Single Father Poverty
Single Father Poverty Comparison
Cherokee
Alaskan Athabascans
19.6%
SINGLE FATHER POVERTY
0.0/ 100
METRIC RATING
321st/ 347
METRIC RANK
18.1%
SINGLE FATHER POVERTY
0.0/ 100
METRIC RATING
291st/ 347
METRIC RANK
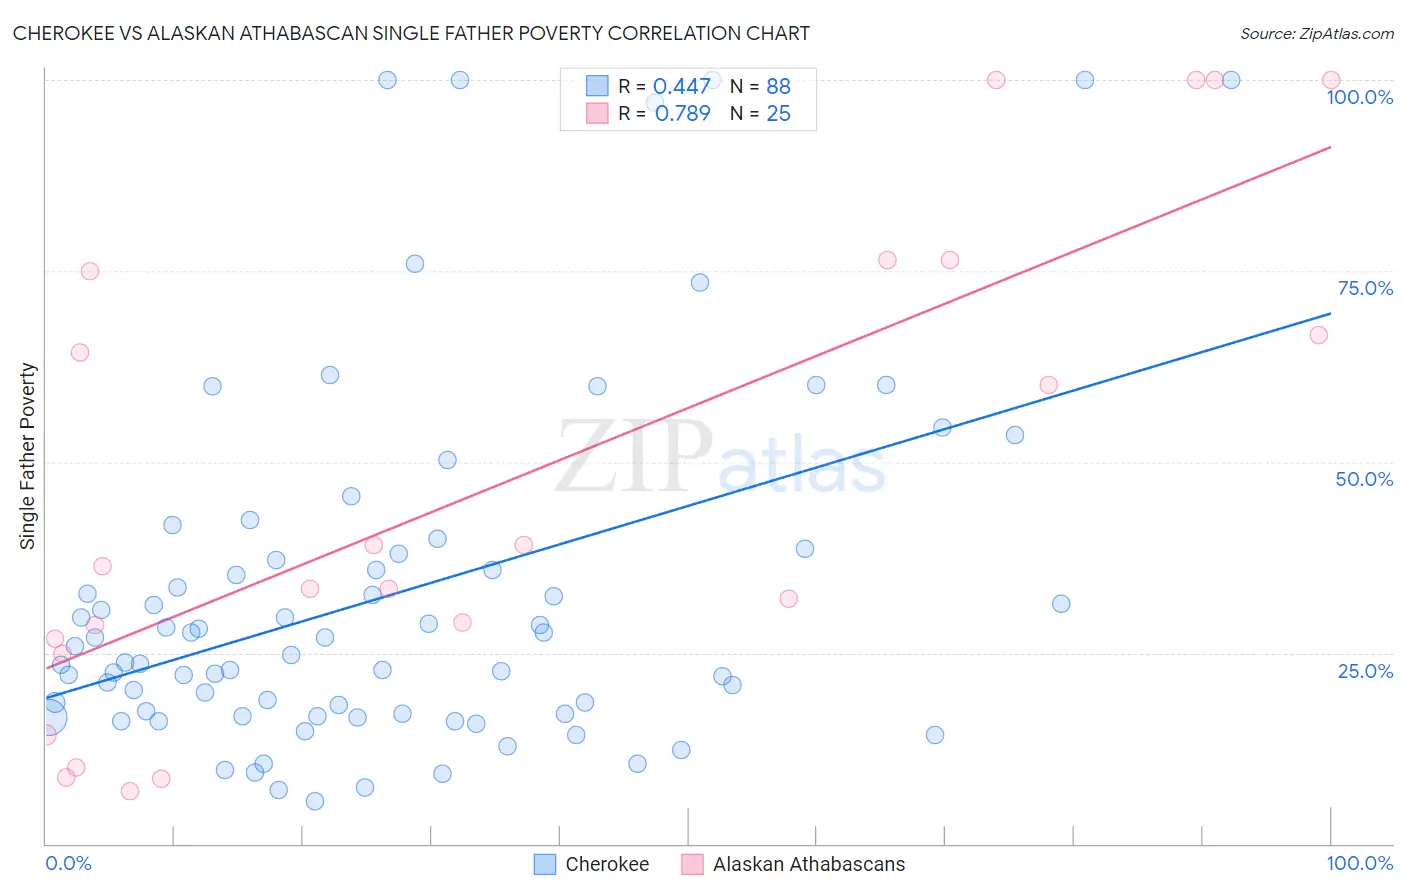
Cherokee vs Alaskan Athabascan Single Father Poverty Correlation Chart
The statistical analysis conducted on geographies consisting of 376,598,860 people shows a moderate positive correlation between the proportion of Cherokee and poverty level among single fathers in the United States with a correlation coefficient (R) of 0.447 and weighted average of 19.6%. Similarly, the statistical analysis conducted on geographies consisting of 42,873,910 people shows a strong positive correlation between the proportion of Alaskan Athabascans and poverty level among single fathers in the United States with a correlation coefficient (R) of 0.789 and weighted average of 18.1%, a difference of 8.6%.
Single Father Poverty Correlation Summary
| Measurement | Cherokee | Alaskan Athabascan |
| Minimum | 5.6% | 6.9% |
| Maximum | 100.0% | 100.0% |
| Range | 94.4% | 93.1% |
| Mean | 32.7% | 47.6% |
| Median | 25.3% | 36.4% |
| Interquartile 25% (IQ1) | 17.1% | 25.8% |
| Interquartile 75% (IQ3) | 37.5% | 75.7% |
| Interquartile Range (IQR) | 20.4% | 49.9% |
| Standard Deviation (Sample) | 23.5% | 31.6% |
| Standard Deviation (Population) | 23.4% | 31.0% |
Similar Demographics by Single Father Poverty
Demographics Similar to Cherokee by Single Father Poverty
In terms of single father poverty, the demographic groups most similar to Cherokee are Inupiat (19.5%, a difference of 0.85%), Creek (19.8%, a difference of 1.0%), Slovak (19.3%, a difference of 1.8%), Pennsylvania German (20.0%, a difference of 1.9%), and American (20.1%, a difference of 2.1%).
| Demographics | Rating | Rank | Single Father Poverty |
| Delaware | 0.0 /100 | #314 | Tragic 18.9% |
| Chickasaw | 0.0 /100 | #315 | Tragic 19.0% |
| Osage | 0.0 /100 | #316 | Tragic 19.0% |
| Dominicans | 0.0 /100 | #317 | Tragic 19.1% |
| Dutch West Indians | 0.0 /100 | #318 | Tragic 19.2% |
| Slovaks | 0.0 /100 | #319 | Tragic 19.3% |
| Inupiat | 0.0 /100 | #320 | Tragic 19.5% |
| Cherokee | 0.0 /100 | #321 | Tragic 19.6% |
| Creek | 0.0 /100 | #322 | Tragic 19.8% |
| Pennsylvania Germans | 0.0 /100 | #323 | Tragic 20.0% |
| Americans | 0.0 /100 | #324 | Tragic 20.1% |
| Blacks/African Americans | 0.0 /100 | #325 | Tragic 20.4% |
| Immigrants | Yemen | 0.0 /100 | #326 | Tragic 20.6% |
| Choctaw | 0.0 /100 | #327 | Tragic 20.7% |
| Pueblo | 0.0 /100 | #328 | Tragic 21.1% |
Demographics Similar to Alaskan Athabascans by Single Father Poverty
In terms of single father poverty, the demographic groups most similar to Alaskan Athabascans are Immigrants from Bahamas (18.1%, a difference of 0.010%), Alaska Native (18.1%, a difference of 0.12%), U.S. Virgin Islander (18.1%, a difference of 0.14%), Yakama (18.1%, a difference of 0.20%), and West Indian (18.0%, a difference of 0.22%).
| Demographics | Rating | Rank | Single Father Poverty |
| Welsh | 0.0 /100 | #284 | Tragic 17.8% |
| Immigrants | Lebanon | 0.0 /100 | #285 | Tragic 17.9% |
| Immigrants | North Macedonia | 0.0 /100 | #286 | Tragic 17.9% |
| Carpatho Rusyns | 0.0 /100 | #287 | Tragic 18.0% |
| Bahamians | 0.0 /100 | #288 | Tragic 18.0% |
| Irish | 0.0 /100 | #289 | Tragic 18.0% |
| West Indians | 0.0 /100 | #290 | Tragic 18.0% |
| Alaskan Athabascans | 0.0 /100 | #291 | Tragic 18.1% |
| Immigrants | Bahamas | 0.0 /100 | #292 | Tragic 18.1% |
| Alaska Natives | 0.0 /100 | #293 | Tragic 18.1% |
| U.S. Virgin Islanders | 0.0 /100 | #294 | Tragic 18.1% |
| Yakama | 0.0 /100 | #295 | Tragic 18.1% |
| Seminole | 0.0 /100 | #296 | Tragic 18.1% |
| French | 0.0 /100 | #297 | Tragic 18.2% |
| Africans | 0.0 /100 | #298 | Tragic 18.3% |