Kiowa vs Immigrants from Brazil Single Father Poverty
COMPARE
Kiowa
Immigrants from Brazil
Single Father Poverty
Single Father Poverty Comparison
Kiowa
Immigrants from Brazil
22.5%
SINGLE FATHER POVERTY
0.0/ 100
METRIC RATING
334th/ 347
METRIC RANK
15.3%
SINGLE FATHER POVERTY
99.6/ 100
METRIC RATING
71st/ 347
METRIC RANK
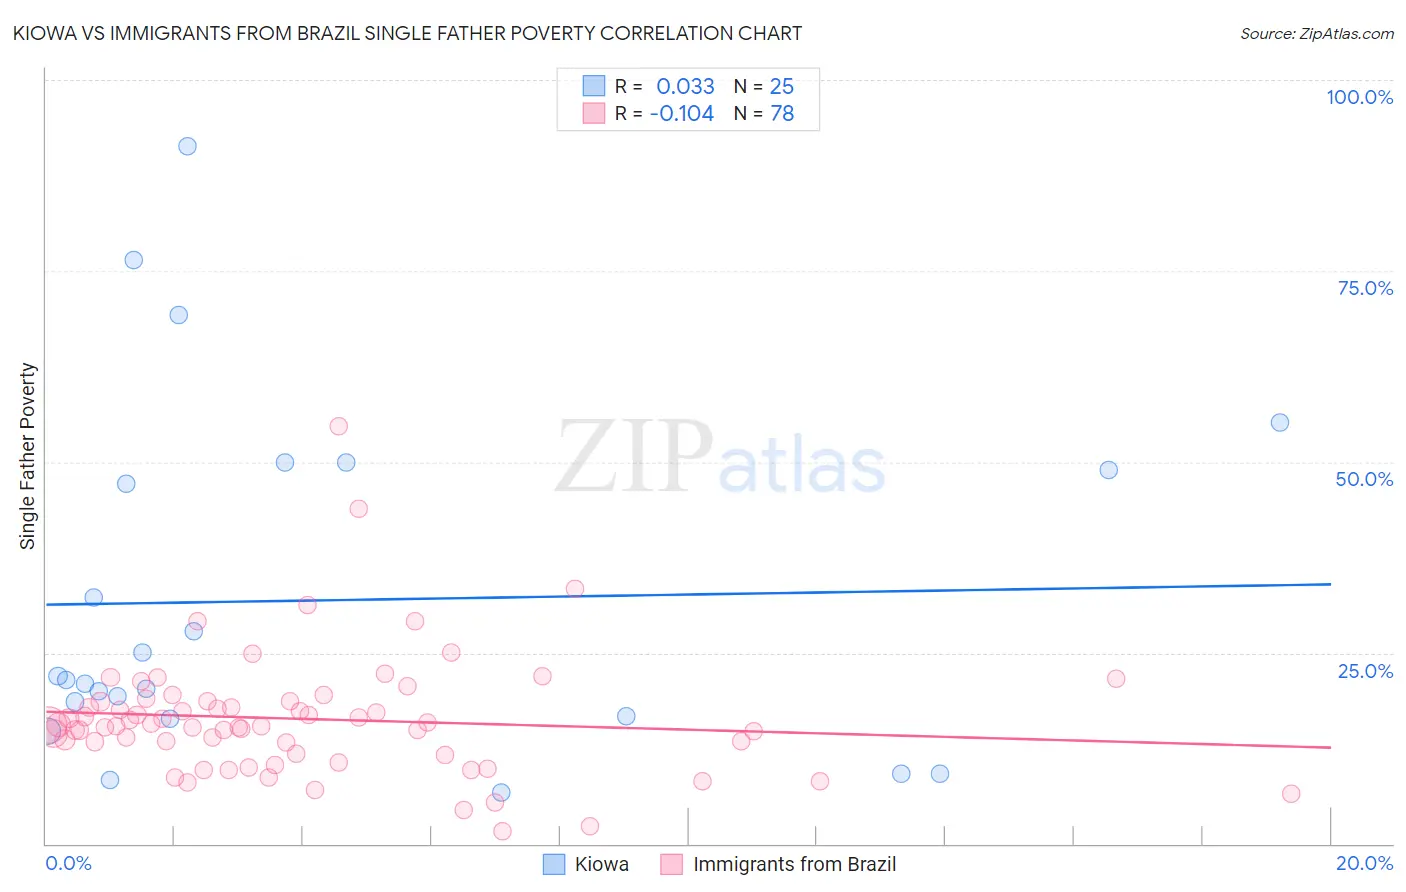
Kiowa vs Immigrants from Brazil Single Father Poverty Correlation Chart
The statistical analysis conducted on geographies consisting of 53,338,998 people shows no correlation between the proportion of Kiowa and poverty level among single fathers in the United States with a correlation coefficient (R) of 0.033 and weighted average of 22.5%. Similarly, the statistical analysis conducted on geographies consisting of 271,222,328 people shows a poor negative correlation between the proportion of Immigrants from Brazil and poverty level among single fathers in the United States with a correlation coefficient (R) of -0.104 and weighted average of 15.3%, a difference of 47.0%.
Single Father Poverty Correlation Summary
| Measurement | Kiowa | Immigrants from Brazil |
| Minimum | 6.7% | 1.7% |
| Maximum | 91.3% | 54.6% |
| Range | 84.6% | 53.0% |
| Mean | 31.9% | 16.3% |
| Median | 21.5% | 15.5% |
| Interquartile 25% (IQ1) | 16.5% | 11.8% |
| Interquartile 75% (IQ3) | 49.5% | 18.6% |
| Interquartile Range (IQR) | 33.0% | 6.8% |
| Standard Deviation (Sample) | 22.9% | 8.1% |
| Standard Deviation (Population) | 22.5% | 8.0% |
Similar Demographics by Single Father Poverty
Demographics Similar to Kiowa by Single Father Poverty
In terms of single father poverty, the demographic groups most similar to Kiowa are Native/Alaskan (22.4%, a difference of 0.36%), Shoshone (22.9%, a difference of 2.0%), Tohono O'odham (22.0%, a difference of 2.1%), Cajun (23.1%, a difference of 2.7%), and Central American Indian (21.7%, a difference of 3.6%).
| Demographics | Rating | Rank | Single Father Poverty |
| Choctaw | 0.0 /100 | #327 | Tragic 20.7% |
| Pueblo | 0.0 /100 | #328 | Tragic 21.1% |
| Colville | 0.0 /100 | #329 | Tragic 21.4% |
| Paiute | 0.0 /100 | #330 | Tragic 21.6% |
| Central American Indians | 0.0 /100 | #331 | Tragic 21.7% |
| Tohono O'odham | 0.0 /100 | #332 | Tragic 22.0% |
| Natives/Alaskans | 0.0 /100 | #333 | Tragic 22.4% |
| Kiowa | 0.0 /100 | #334 | Tragic 22.5% |
| Shoshone | 0.0 /100 | #335 | Tragic 22.9% |
| Cajuns | 0.0 /100 | #336 | Tragic 23.1% |
| Sioux | 0.0 /100 | #337 | Tragic 23.9% |
| Arapaho | 0.0 /100 | #338 | Tragic 24.0% |
| Apache | 0.0 /100 | #339 | Tragic 24.2% |
| Houma | 0.0 /100 | #340 | Tragic 26.7% |
| Hopi | 0.0 /100 | #341 | Tragic 27.2% |
Demographics Similar to Immigrants from Brazil by Single Father Poverty
In terms of single father poverty, the demographic groups most similar to Immigrants from Brazil are Immigrants from Lithuania (15.3%, a difference of 0.12%), Mongolian (15.3%, a difference of 0.21%), Kenyan (15.3%, a difference of 0.21%), Maltese (15.3%, a difference of 0.25%), and Immigrants from Turkey (15.3%, a difference of 0.27%).
| Demographics | Rating | Rank | Single Father Poverty |
| Bangladeshis | 99.8 /100 | #64 | Exceptional 15.2% |
| Immigrants | Malaysia | 99.8 /100 | #65 | Exceptional 15.2% |
| Immigrants | Moldova | 99.8 /100 | #66 | Exceptional 15.2% |
| Paraguayans | 99.7 /100 | #67 | Exceptional 15.2% |
| Immigrants | Cameroon | 99.7 /100 | #68 | Exceptional 15.2% |
| Japanese | 99.7 /100 | #69 | Exceptional 15.2% |
| Mongolians | 99.7 /100 | #70 | Exceptional 15.3% |
| Immigrants | Brazil | 99.6 /100 | #71 | Exceptional 15.3% |
| Immigrants | Lithuania | 99.6 /100 | #72 | Exceptional 15.3% |
| Kenyans | 99.6 /100 | #73 | Exceptional 15.3% |
| Maltese | 99.6 /100 | #74 | Exceptional 15.3% |
| Immigrants | Turkey | 99.5 /100 | #75 | Exceptional 15.3% |
| Immigrants | Japan | 99.5 /100 | #76 | Exceptional 15.3% |
| Immigrants | Peru | 99.5 /100 | #77 | Exceptional 15.3% |
| Tlingit-Haida | 99.5 /100 | #78 | Exceptional 15.3% |