Kiowa vs Uruguayan Single Father Poverty
COMPARE
Kiowa
Uruguayan
Single Father Poverty
Single Father Poverty Comparison
Kiowa
Uruguayans
22.5%
SINGLE FATHER POVERTY
0.0/ 100
METRIC RATING
334th/ 347
METRIC RANK
15.9%
SINGLE FATHER POVERTY
92.1/ 100
METRIC RATING
120th/ 347
METRIC RANK
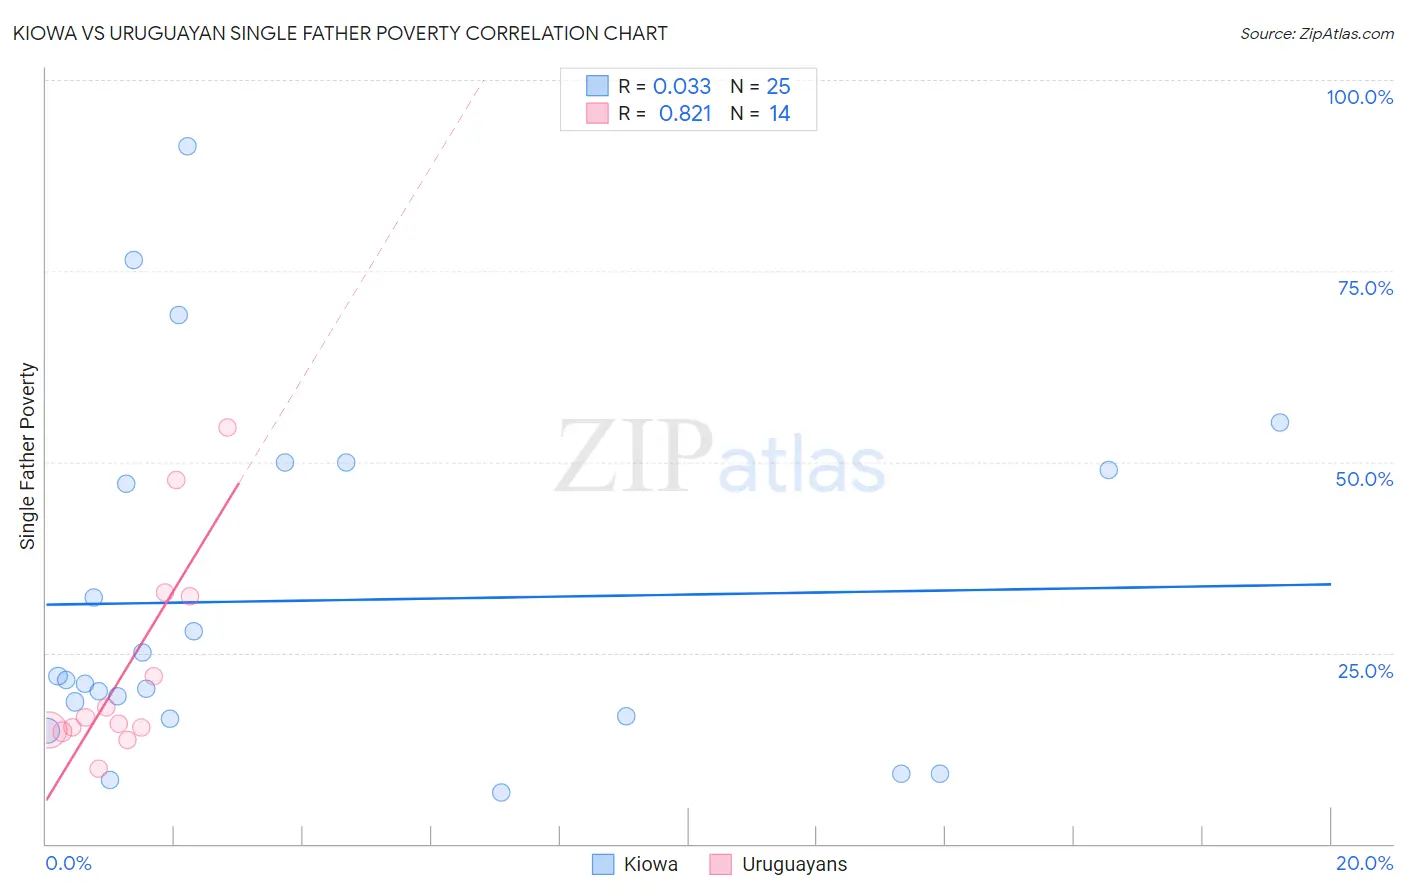
Kiowa vs Uruguayan Single Father Poverty Correlation Chart
The statistical analysis conducted on geographies consisting of 53,338,998 people shows no correlation between the proportion of Kiowa and poverty level among single fathers in the United States with a correlation coefficient (R) of 0.033 and weighted average of 22.5%. Similarly, the statistical analysis conducted on geographies consisting of 126,833,155 people shows a very strong positive correlation between the proportion of Uruguayans and poverty level among single fathers in the United States with a correlation coefficient (R) of 0.821 and weighted average of 15.9%, a difference of 41.7%.
Single Father Poverty Correlation Summary
| Measurement | Kiowa | Uruguayan |
| Minimum | 6.7% | 9.8% |
| Maximum | 91.3% | 54.5% |
| Range | 84.6% | 44.7% |
| Mean | 31.9% | 23.1% |
| Median | 21.5% | 16.1% |
| Interquartile 25% (IQ1) | 16.5% | 15.0% |
| Interquartile 75% (IQ3) | 49.5% | 32.4% |
| Interquartile Range (IQR) | 33.0% | 17.4% |
| Standard Deviation (Sample) | 22.9% | 13.7% |
| Standard Deviation (Population) | 22.5% | 13.2% |
Similar Demographics by Single Father Poverty
Demographics Similar to Kiowa by Single Father Poverty
In terms of single father poverty, the demographic groups most similar to Kiowa are Native/Alaskan (22.4%, a difference of 0.36%), Shoshone (22.9%, a difference of 2.0%), Tohono O'odham (22.0%, a difference of 2.1%), Cajun (23.1%, a difference of 2.7%), and Central American Indian (21.7%, a difference of 3.6%).
| Demographics | Rating | Rank | Single Father Poverty |
| Choctaw | 0.0 /100 | #327 | Tragic 20.7% |
| Pueblo | 0.0 /100 | #328 | Tragic 21.1% |
| Colville | 0.0 /100 | #329 | Tragic 21.4% |
| Paiute | 0.0 /100 | #330 | Tragic 21.6% |
| Central American Indians | 0.0 /100 | #331 | Tragic 21.7% |
| Tohono O'odham | 0.0 /100 | #332 | Tragic 22.0% |
| Natives/Alaskans | 0.0 /100 | #333 | Tragic 22.4% |
| Kiowa | 0.0 /100 | #334 | Tragic 22.5% |
| Shoshone | 0.0 /100 | #335 | Tragic 22.9% |
| Cajuns | 0.0 /100 | #336 | Tragic 23.1% |
| Sioux | 0.0 /100 | #337 | Tragic 23.9% |
| Arapaho | 0.0 /100 | #338 | Tragic 24.0% |
| Apache | 0.0 /100 | #339 | Tragic 24.2% |
| Houma | 0.0 /100 | #340 | Tragic 26.7% |
| Hopi | 0.0 /100 | #341 | Tragic 27.2% |
Demographics Similar to Uruguayans by Single Father Poverty
In terms of single father poverty, the demographic groups most similar to Uruguayans are Immigrants (15.9%, a difference of 0.020%), Immigrants from Belarus (15.8%, a difference of 0.060%), Immigrants from Eastern Europe (15.8%, a difference of 0.070%), Sudanese (15.9%, a difference of 0.080%), and Immigrants from Colombia (15.8%, a difference of 0.090%).
| Demographics | Rating | Rank | Single Father Poverty |
| Danes | 94.5 /100 | #113 | Exceptional 15.8% |
| Argentineans | 94.4 /100 | #114 | Exceptional 15.8% |
| Immigrants | Thailand | 93.6 /100 | #115 | Exceptional 15.8% |
| Immigrants | Argentina | 92.8 /100 | #116 | Exceptional 15.8% |
| Immigrants | Colombia | 92.6 /100 | #117 | Exceptional 15.8% |
| Immigrants | Eastern Europe | 92.5 /100 | #118 | Exceptional 15.8% |
| Immigrants | Belarus | 92.4 /100 | #119 | Exceptional 15.8% |
| Uruguayans | 92.1 /100 | #120 | Exceptional 15.9% |
| Immigrants | Immigrants | 91.9 /100 | #121 | Exceptional 15.9% |
| Sudanese | 91.6 /100 | #122 | Exceptional 15.9% |
| Palestinians | 91.3 /100 | #123 | Exceptional 15.9% |
| Immigrants | Panama | 91.3 /100 | #124 | Exceptional 15.9% |
| Iraqis | 91.2 /100 | #125 | Exceptional 15.9% |
| Hmong | 91.1 /100 | #126 | Exceptional 15.9% |
| Immigrants | Liberia | 91.1 /100 | #127 | Exceptional 15.9% |