Laotian vs Alaskan Athabascan Single Father Poverty
COMPARE
Laotian
Alaskan Athabascan
Single Father Poverty
Single Father Poverty Comparison
Laotians
Alaskan Athabascans
15.1%
SINGLE FATHER POVERTY
99.9/ 100
METRIC RATING
57th/ 347
METRIC RANK
18.1%
SINGLE FATHER POVERTY
0.0/ 100
METRIC RATING
291st/ 347
METRIC RANK
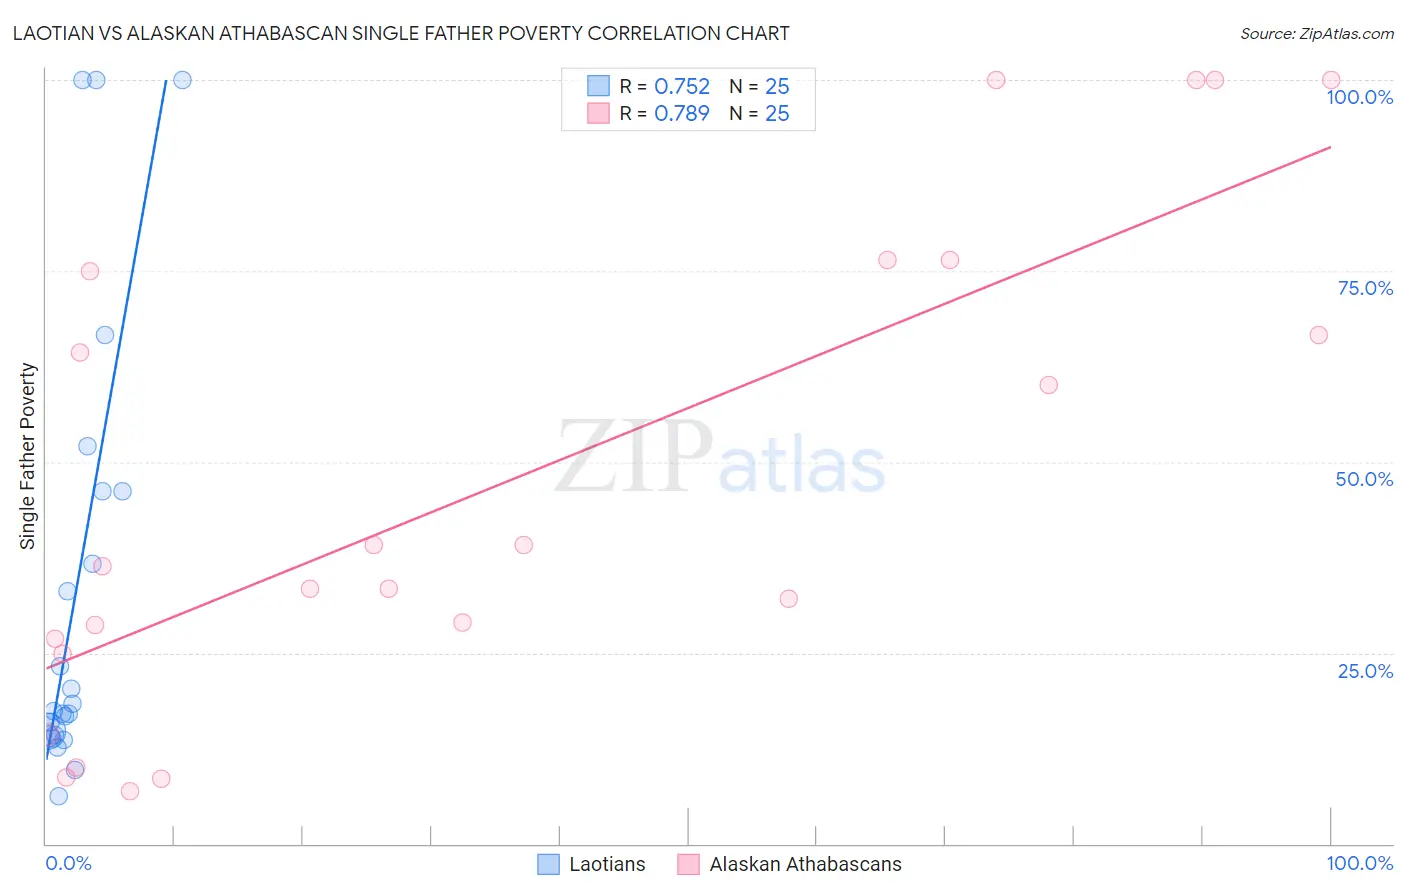
Laotian vs Alaskan Athabascan Single Father Poverty Correlation Chart
The statistical analysis conducted on geographies consisting of 189,346,173 people shows a strong positive correlation between the proportion of Laotians and poverty level among single fathers in the United States with a correlation coefficient (R) of 0.752 and weighted average of 15.1%. Similarly, the statistical analysis conducted on geographies consisting of 42,873,910 people shows a strong positive correlation between the proportion of Alaskan Athabascans and poverty level among single fathers in the United States with a correlation coefficient (R) of 0.789 and weighted average of 18.1%, a difference of 20.0%.
Single Father Poverty Correlation Summary
| Measurement | Laotian | Alaskan Athabascan |
| Minimum | 6.3% | 6.9% |
| Maximum | 100.0% | 100.0% |
| Range | 93.7% | 93.1% |
| Mean | 33.0% | 47.6% |
| Median | 17.4% | 36.4% |
| Interquartile 25% (IQ1) | 14.1% | 25.8% |
| Interquartile 75% (IQ3) | 46.1% | 75.7% |
| Interquartile Range (IQR) | 32.0% | 49.9% |
| Standard Deviation (Sample) | 29.3% | 31.6% |
| Standard Deviation (Population) | 28.7% | 31.0% |
Similar Demographics by Single Father Poverty
Demographics Similar to Laotians by Single Father Poverty
In terms of single father poverty, the demographic groups most similar to Laotians are Hawaiian (15.1%, a difference of 0.060%), Immigrants from Laos (15.1%, a difference of 0.090%), Guamanian/Chamorro (15.1%, a difference of 0.15%), Immigrants from Bulgaria (15.0%, a difference of 0.36%), and Immigrants from Uzbekistan (15.0%, a difference of 0.41%).
| Demographics | Rating | Rank | Single Father Poverty |
| Bhutanese | 99.9 /100 | #50 | Exceptional 15.0% |
| Immigrants | Pakistan | 99.9 /100 | #51 | Exceptional 15.0% |
| Immigrants | El Salvador | 99.9 /100 | #52 | Exceptional 15.0% |
| Immigrants | Kenya | 99.9 /100 | #53 | Exceptional 15.0% |
| Immigrants | Uzbekistan | 99.9 /100 | #54 | Exceptional 15.0% |
| Immigrants | Bulgaria | 99.9 /100 | #55 | Exceptional 15.0% |
| Immigrants | Laos | 99.9 /100 | #56 | Exceptional 15.1% |
| Laotians | 99.9 /100 | #57 | Exceptional 15.1% |
| Hawaiians | 99.9 /100 | #58 | Exceptional 15.1% |
| Guamanians/Chamorros | 99.9 /100 | #59 | Exceptional 15.1% |
| Puget Sound Salish | 99.8 /100 | #60 | Exceptional 15.2% |
| Immigrants | Bosnia and Herzegovina | 99.8 /100 | #61 | Exceptional 15.2% |
| Immigrants | Armenia | 99.8 /100 | #62 | Exceptional 15.2% |
| Immigrants | Sweden | 99.8 /100 | #63 | Exceptional 15.2% |
| Bangladeshis | 99.8 /100 | #64 | Exceptional 15.2% |
Demographics Similar to Alaskan Athabascans by Single Father Poverty
In terms of single father poverty, the demographic groups most similar to Alaskan Athabascans are Immigrants from Bahamas (18.1%, a difference of 0.010%), Alaska Native (18.1%, a difference of 0.12%), U.S. Virgin Islander (18.1%, a difference of 0.14%), Yakama (18.1%, a difference of 0.20%), and West Indian (18.0%, a difference of 0.22%).
| Demographics | Rating | Rank | Single Father Poverty |
| Welsh | 0.0 /100 | #284 | Tragic 17.8% |
| Immigrants | Lebanon | 0.0 /100 | #285 | Tragic 17.9% |
| Immigrants | North Macedonia | 0.0 /100 | #286 | Tragic 17.9% |
| Carpatho Rusyns | 0.0 /100 | #287 | Tragic 18.0% |
| Bahamians | 0.0 /100 | #288 | Tragic 18.0% |
| Irish | 0.0 /100 | #289 | Tragic 18.0% |
| West Indians | 0.0 /100 | #290 | Tragic 18.0% |
| Alaskan Athabascans | 0.0 /100 | #291 | Tragic 18.1% |
| Immigrants | Bahamas | 0.0 /100 | #292 | Tragic 18.1% |
| Alaska Natives | 0.0 /100 | #293 | Tragic 18.1% |
| U.S. Virgin Islanders | 0.0 /100 | #294 | Tragic 18.1% |
| Yakama | 0.0 /100 | #295 | Tragic 18.1% |
| Seminole | 0.0 /100 | #296 | Tragic 18.1% |
| French | 0.0 /100 | #297 | Tragic 18.2% |
| Africans | 0.0 /100 | #298 | Tragic 18.3% |