Nigerian vs Alaskan Athabascan Single Father Poverty
COMPARE
Nigerian
Alaskan Athabascan
Single Father Poverty
Single Father Poverty Comparison
Nigerians
Alaskan Athabascans
16.1%
SINGLE FATHER POVERTY
76.8/ 100
METRIC RATING
148th/ 347
METRIC RANK
18.1%
SINGLE FATHER POVERTY
0.0/ 100
METRIC RATING
291st/ 347
METRIC RANK
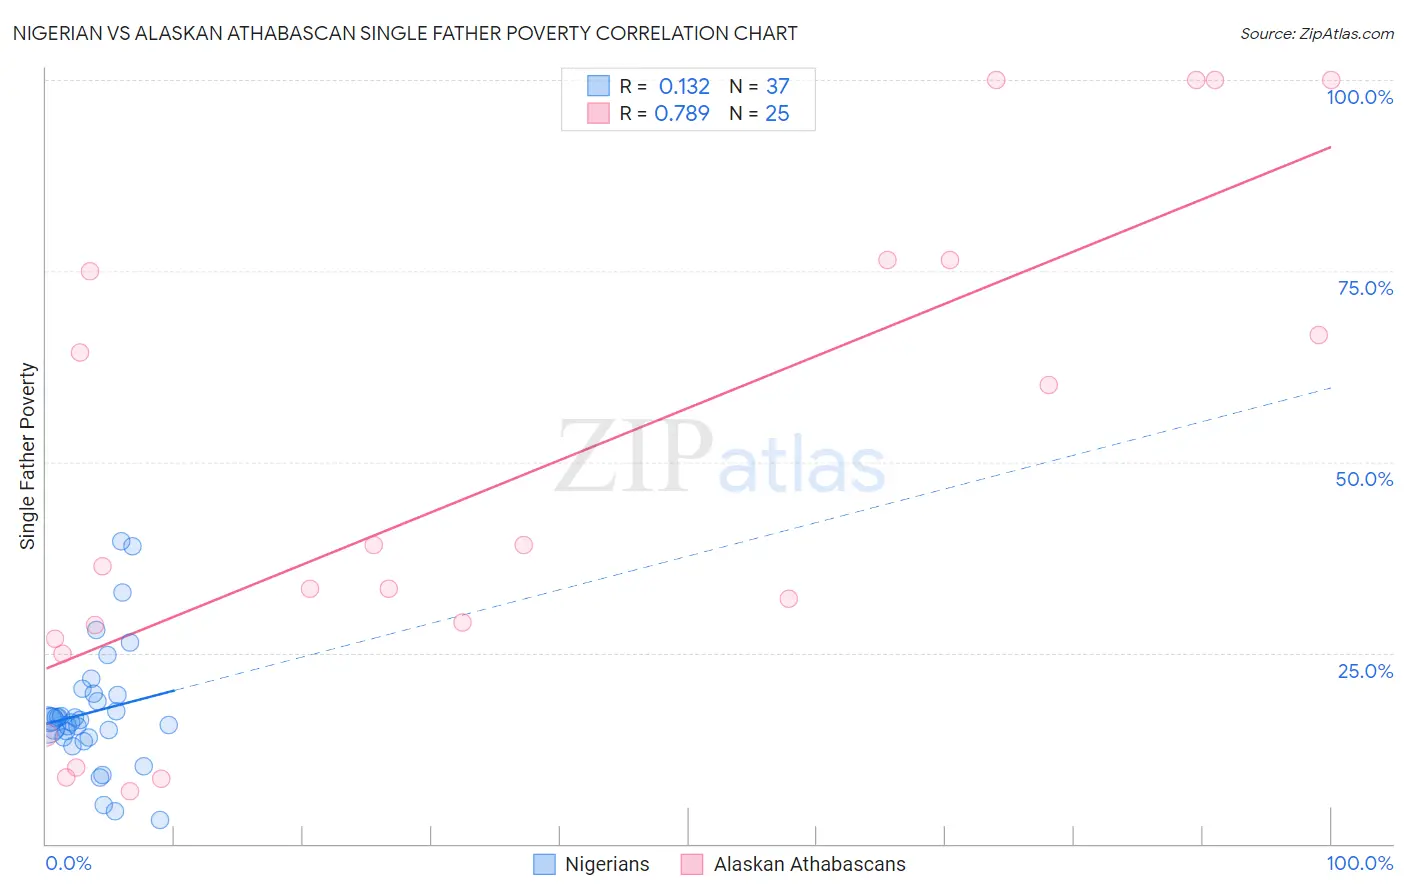
Nigerian vs Alaskan Athabascan Single Father Poverty Correlation Chart
The statistical analysis conducted on geographies consisting of 274,896,002 people shows a poor positive correlation between the proportion of Nigerians and poverty level among single fathers in the United States with a correlation coefficient (R) of 0.132 and weighted average of 16.1%. Similarly, the statistical analysis conducted on geographies consisting of 42,873,910 people shows a strong positive correlation between the proportion of Alaskan Athabascans and poverty level among single fathers in the United States with a correlation coefficient (R) of 0.789 and weighted average of 18.1%, a difference of 12.5%.
Single Father Poverty Correlation Summary
| Measurement | Nigerian | Alaskan Athabascan |
| Minimum | 3.1% | 6.9% |
| Maximum | 39.7% | 100.0% |
| Range | 36.6% | 93.1% |
| Mean | 17.3% | 47.6% |
| Median | 16.2% | 36.4% |
| Interquartile 25% (IQ1) | 13.9% | 25.8% |
| Interquartile 75% (IQ3) | 19.6% | 75.7% |
| Interquartile Range (IQR) | 5.7% | 49.9% |
| Standard Deviation (Sample) | 8.0% | 31.6% |
| Standard Deviation (Population) | 7.9% | 31.0% |
Similar Demographics by Single Father Poverty
Demographics Similar to Nigerians by Single Father Poverty
In terms of single father poverty, the demographic groups most similar to Nigerians are Colombian (16.1%, a difference of 0.020%), Immigrants from Hungary (16.1%, a difference of 0.10%), South African (16.1%, a difference of 0.10%), Jordanian (16.1%, a difference of 0.16%), and Immigrants from France (16.1%, a difference of 0.22%).
| Demographics | Rating | Rank | Single Father Poverty |
| Liberians | 83.3 /100 | #141 | Excellent 16.0% |
| Immigrants | Mexico | 83.3 /100 | #142 | Excellent 16.0% |
| Immigrants | Central America | 83.1 /100 | #143 | Excellent 16.0% |
| Immigrants | Kuwait | 81.4 /100 | #144 | Excellent 16.0% |
| Immigrants | Western Asia | 80.7 /100 | #145 | Excellent 16.0% |
| Immigrants | Hungary | 78.3 /100 | #146 | Good 16.1% |
| Colombians | 77.1 /100 | #147 | Good 16.1% |
| Nigerians | 76.8 /100 | #148 | Good 16.1% |
| South Africans | 75.1 /100 | #149 | Good 16.1% |
| Jordanians | 74.2 /100 | #150 | Good 16.1% |
| Immigrants | France | 73.1 /100 | #151 | Good 16.1% |
| Immigrants | Zimbabwe | 72.1 /100 | #152 | Good 16.1% |
| Immigrants | Israel | 72.0 /100 | #153 | Good 16.1% |
| Mexicans | 70.1 /100 | #154 | Good 16.1% |
| Immigrants | Nicaragua | 67.8 /100 | #155 | Good 16.2% |
Demographics Similar to Alaskan Athabascans by Single Father Poverty
In terms of single father poverty, the demographic groups most similar to Alaskan Athabascans are Immigrants from Bahamas (18.1%, a difference of 0.010%), Alaska Native (18.1%, a difference of 0.12%), U.S. Virgin Islander (18.1%, a difference of 0.14%), Yakama (18.1%, a difference of 0.20%), and West Indian (18.0%, a difference of 0.22%).
| Demographics | Rating | Rank | Single Father Poverty |
| Welsh | 0.0 /100 | #284 | Tragic 17.8% |
| Immigrants | Lebanon | 0.0 /100 | #285 | Tragic 17.9% |
| Immigrants | North Macedonia | 0.0 /100 | #286 | Tragic 17.9% |
| Carpatho Rusyns | 0.0 /100 | #287 | Tragic 18.0% |
| Bahamians | 0.0 /100 | #288 | Tragic 18.0% |
| Irish | 0.0 /100 | #289 | Tragic 18.0% |
| West Indians | 0.0 /100 | #290 | Tragic 18.0% |
| Alaskan Athabascans | 0.0 /100 | #291 | Tragic 18.1% |
| Immigrants | Bahamas | 0.0 /100 | #292 | Tragic 18.1% |
| Alaska Natives | 0.0 /100 | #293 | Tragic 18.1% |
| U.S. Virgin Islanders | 0.0 /100 | #294 | Tragic 18.1% |
| Yakama | 0.0 /100 | #295 | Tragic 18.1% |
| Seminole | 0.0 /100 | #296 | Tragic 18.1% |
| French | 0.0 /100 | #297 | Tragic 18.2% |
| Africans | 0.0 /100 | #298 | Tragic 18.3% |