Immigrants from Iran vs Alaskan Athabascan Single Father Poverty
COMPARE
Immigrants from Iran
Alaskan Athabascan
Single Father Poverty
Single Father Poverty Comparison
Immigrants from Iran
Alaskan Athabascans
14.2%
SINGLE FATHER POVERTY
100.0/ 100
METRIC RATING
16th/ 347
METRIC RANK
18.1%
SINGLE FATHER POVERTY
0.0/ 100
METRIC RATING
291st/ 347
METRIC RANK
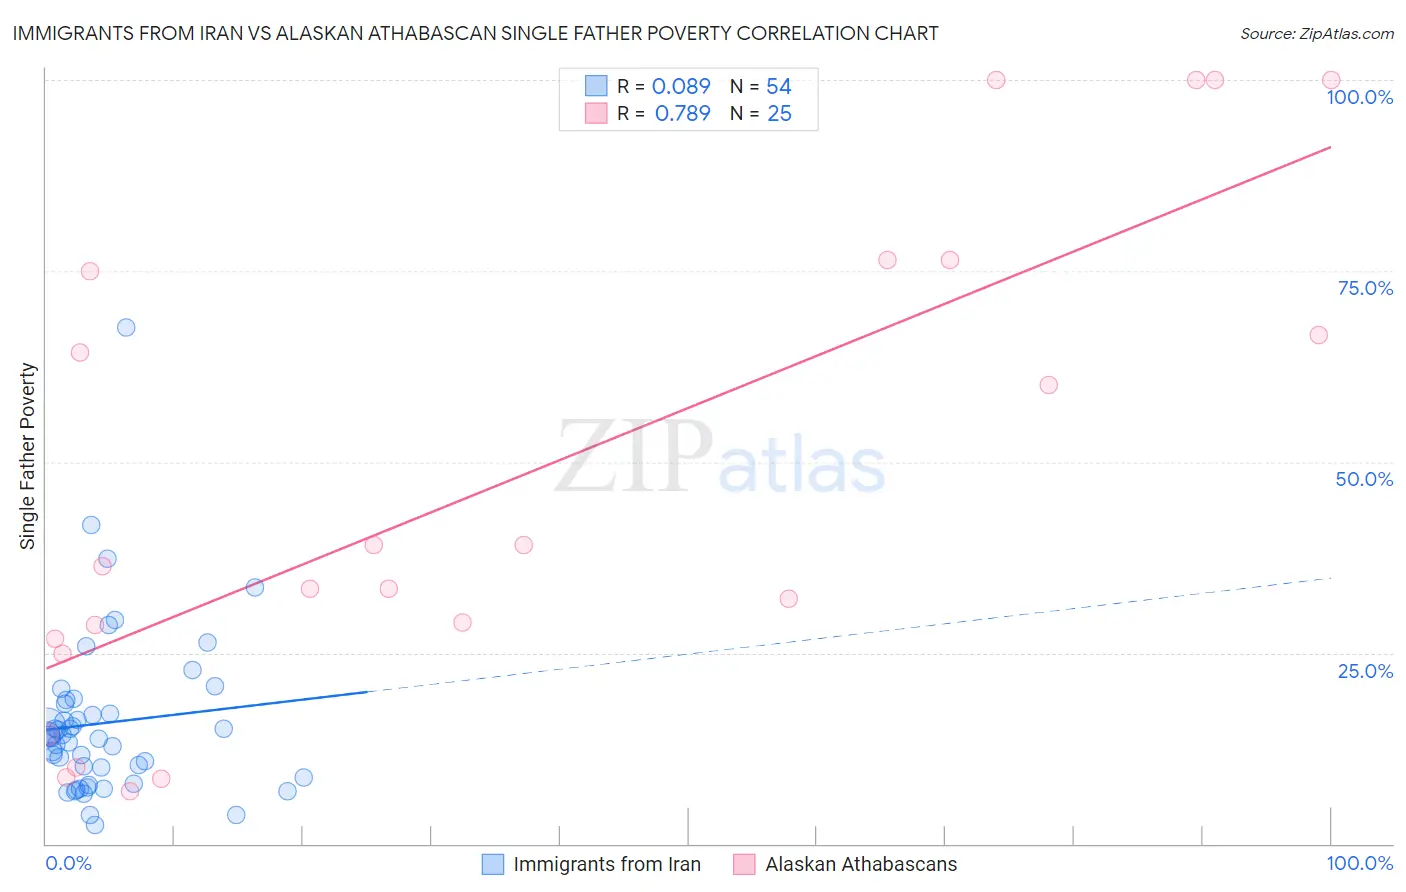
Immigrants from Iran vs Alaskan Athabascan Single Father Poverty Correlation Chart
The statistical analysis conducted on geographies consisting of 227,784,696 people shows a slight positive correlation between the proportion of Immigrants from Iran and poverty level among single fathers in the United States with a correlation coefficient (R) of 0.089 and weighted average of 14.2%. Similarly, the statistical analysis conducted on geographies consisting of 42,873,910 people shows a strong positive correlation between the proportion of Alaskan Athabascans and poverty level among single fathers in the United States with a correlation coefficient (R) of 0.789 and weighted average of 18.1%, a difference of 27.5%.
Single Father Poverty Correlation Summary
| Measurement | Immigrants from Iran | Alaskan Athabascan |
| Minimum | 2.4% | 6.9% |
| Maximum | 67.6% | 100.0% |
| Range | 65.1% | 93.1% |
| Mean | 15.8% | 47.6% |
| Median | 14.0% | 36.4% |
| Interquartile 25% (IQ1) | 8.7% | 25.8% |
| Interquartile 75% (IQ3) | 18.3% | 75.7% |
| Interquartile Range (IQR) | 9.6% | 49.9% |
| Standard Deviation (Sample) | 10.9% | 31.6% |
| Standard Deviation (Population) | 10.8% | 31.0% |
Similar Demographics by Single Father Poverty
Demographics Similar to Immigrants from Iran by Single Father Poverty
In terms of single father poverty, the demographic groups most similar to Immigrants from Iran are Sri Lankan (14.2%, a difference of 0.20%), Immigrants from Vietnam (14.1%, a difference of 0.26%), Immigrants from Hong Kong (14.2%, a difference of 0.45%), Soviet Union (14.3%, a difference of 0.48%), and Immigrants from Iraq (14.3%, a difference of 0.52%).
| Demographics | Rating | Rank | Single Father Poverty |
| Afghans | 100.0 /100 | #9 | Exceptional 14.0% |
| Koreans | 100.0 /100 | #10 | Exceptional 14.0% |
| Filipinos | 100.0 /100 | #11 | Exceptional 14.0% |
| Immigrants | India | 100.0 /100 | #12 | Exceptional 14.0% |
| Immigrants | Philippines | 100.0 /100 | #13 | Exceptional 14.0% |
| Immigrants | Vietnam | 100.0 /100 | #14 | Exceptional 14.1% |
| Sri Lankans | 100.0 /100 | #15 | Exceptional 14.2% |
| Immigrants | Iran | 100.0 /100 | #16 | Exceptional 14.2% |
| Immigrants | Hong Kong | 100.0 /100 | #17 | Exceptional 14.2% |
| Soviet Union | 100.0 /100 | #18 | Exceptional 14.3% |
| Immigrants | Iraq | 100.0 /100 | #19 | Exceptional 14.3% |
| Immigrants | Singapore | 100.0 /100 | #20 | Exceptional 14.3% |
| Immigrants | Afghanistan | 100.0 /100 | #21 | Exceptional 14.3% |
| Taiwanese | 100.0 /100 | #22 | Exceptional 14.3% |
| Immigrants | Egypt | 100.0 /100 | #23 | Exceptional 14.4% |
Demographics Similar to Alaskan Athabascans by Single Father Poverty
In terms of single father poverty, the demographic groups most similar to Alaskan Athabascans are Immigrants from Bahamas (18.1%, a difference of 0.010%), Alaska Native (18.1%, a difference of 0.12%), U.S. Virgin Islander (18.1%, a difference of 0.14%), Yakama (18.1%, a difference of 0.20%), and West Indian (18.0%, a difference of 0.22%).
| Demographics | Rating | Rank | Single Father Poverty |
| Welsh | 0.0 /100 | #284 | Tragic 17.8% |
| Immigrants | Lebanon | 0.0 /100 | #285 | Tragic 17.9% |
| Immigrants | North Macedonia | 0.0 /100 | #286 | Tragic 17.9% |
| Carpatho Rusyns | 0.0 /100 | #287 | Tragic 18.0% |
| Bahamians | 0.0 /100 | #288 | Tragic 18.0% |
| Irish | 0.0 /100 | #289 | Tragic 18.0% |
| West Indians | 0.0 /100 | #290 | Tragic 18.0% |
| Alaskan Athabascans | 0.0 /100 | #291 | Tragic 18.1% |
| Immigrants | Bahamas | 0.0 /100 | #292 | Tragic 18.1% |
| Alaska Natives | 0.0 /100 | #293 | Tragic 18.1% |
| U.S. Virgin Islanders | 0.0 /100 | #294 | Tragic 18.1% |
| Yakama | 0.0 /100 | #295 | Tragic 18.1% |
| Seminole | 0.0 /100 | #296 | Tragic 18.1% |
| French | 0.0 /100 | #297 | Tragic 18.2% |
| Africans | 0.0 /100 | #298 | Tragic 18.3% |