Kiowa vs Alaskan Athabascan Per Capita Income
COMPARE
Kiowa
Alaskan Athabascan
Per Capita Income
Per Capita Income Comparison
Kiowa
Alaskan Athabascans
$35,102
PER CAPITA INCOME
0.0/ 100
METRIC RATING
324th/ 347
METRIC RANK
$39,163
PER CAPITA INCOME
0.6/ 100
METRIC RATING
260th/ 347
METRIC RANK
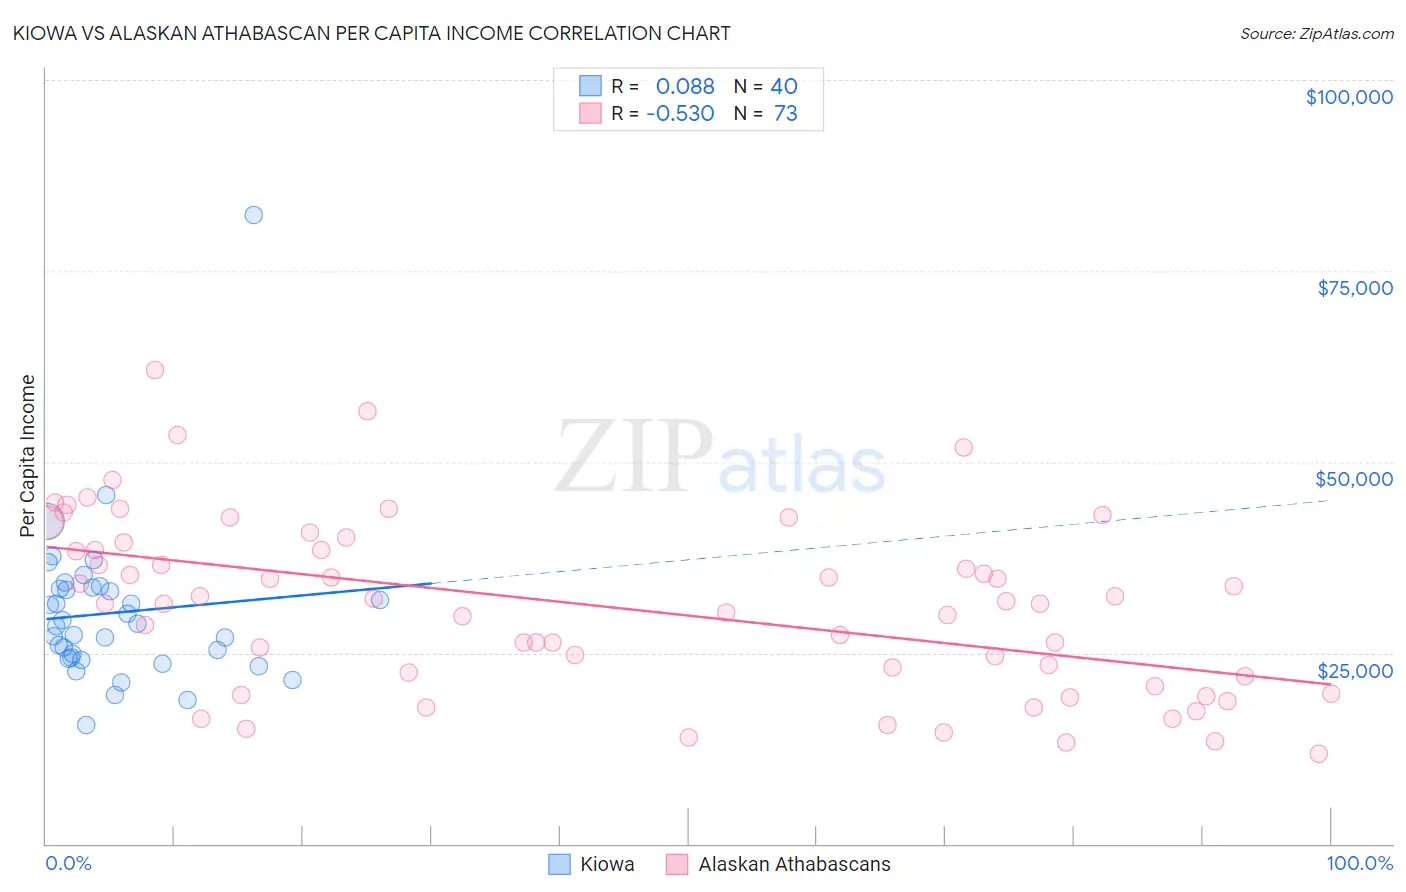
Kiowa vs Alaskan Athabascan Per Capita Income Correlation Chart
The statistical analysis conducted on geographies consisting of 56,101,664 people shows a slight positive correlation between the proportion of Kiowa and per capita income in the United States with a correlation coefficient (R) of 0.088 and weighted average of $35,102. Similarly, the statistical analysis conducted on geographies consisting of 45,821,401 people shows a substantial negative correlation between the proportion of Alaskan Athabascans and per capita income in the United States with a correlation coefficient (R) of -0.530 and weighted average of $39,163, a difference of 11.6%.
Per Capita Income Correlation Summary
| Measurement | Kiowa | Alaskan Athabascan |
| Minimum | $15,468 | $11,811 |
| Maximum | $82,387 | $61,991 |
| Range | $66,919 | $50,180 |
| Mean | $30,249 | $31,098 |
| Median | $28,572 | $31,460 |
| Interquartile 25% (IQ1) | $24,302 | $21,337 |
| Interquartile 75% (IQ3) | $33,441 | $38,931 |
| Interquartile Range (IQR) | $9,140 | $17,594 |
| Standard Deviation (Sample) | $10,578 | $11,398 |
| Standard Deviation (Population) | $10,445 | $11,320 |
Similar Demographics by Per Capita Income
Demographics Similar to Kiowa by Per Capita Income
In terms of per capita income, the demographic groups most similar to Kiowa are Immigrants from Central America ($34,974, a difference of 0.37%), Cheyenne ($35,276, a difference of 0.50%), Immigrants from Cuba ($34,910, a difference of 0.55%), Apache ($34,886, a difference of 0.62%), and Creek ($35,546, a difference of 1.3%).
| Demographics | Rating | Rank | Per Capita Income |
| Dutch West Indians | 0.0 /100 | #317 | Tragic $35,922 |
| Bangladeshis | 0.0 /100 | #318 | Tragic $35,897 |
| Immigrants | Congo | 0.0 /100 | #319 | Tragic $35,720 |
| Hispanics or Latinos | 0.0 /100 | #320 | Tragic $35,688 |
| Blacks/African Americans | 0.0 /100 | #321 | Tragic $35,564 |
| Creek | 0.0 /100 | #322 | Tragic $35,546 |
| Cheyenne | 0.0 /100 | #323 | Tragic $35,276 |
| Kiowa | 0.0 /100 | #324 | Tragic $35,102 |
| Immigrants | Central America | 0.0 /100 | #325 | Tragic $34,974 |
| Immigrants | Cuba | 0.0 /100 | #326 | Tragic $34,910 |
| Apache | 0.0 /100 | #327 | Tragic $34,886 |
| Menominee | 0.0 /100 | #328 | Tragic $34,578 |
| Mexicans | 0.0 /100 | #329 | Tragic $34,559 |
| Spanish American Indians | 0.0 /100 | #330 | Tragic $34,195 |
| Immigrants | Mexico | 0.0 /100 | #331 | Tragic $33,931 |
Demographics Similar to Alaskan Athabascans by Per Capita Income
In terms of per capita income, the demographic groups most similar to Alaskan Athabascans are Malaysian ($39,194, a difference of 0.080%), Marshallese ($39,108, a difference of 0.14%), Iroquois ($39,104, a difference of 0.15%), Jamaican ($39,231, a difference of 0.17%), and Belizean ($39,097, a difference of 0.17%).
| Demographics | Rating | Rank | Per Capita Income |
| Osage | 1.0 /100 | #253 | Tragic $39,568 |
| Alaska Natives | 1.0 /100 | #254 | Tragic $39,558 |
| Immigrants | Middle Africa | 1.0 /100 | #255 | Tragic $39,529 |
| Hawaiians | 0.8 /100 | #256 | Tragic $39,403 |
| Nicaraguans | 0.8 /100 | #257 | Tragic $39,372 |
| Jamaicans | 0.7 /100 | #258 | Tragic $39,231 |
| Malaysians | 0.7 /100 | #259 | Tragic $39,194 |
| Alaskan Athabascans | 0.6 /100 | #260 | Tragic $39,163 |
| Marshallese | 0.6 /100 | #261 | Tragic $39,108 |
| Iroquois | 0.6 /100 | #262 | Tragic $39,104 |
| Belizeans | 0.6 /100 | #263 | Tragic $39,097 |
| Americans | 0.6 /100 | #264 | Tragic $39,039 |
| Spanish Americans | 0.5 /100 | #265 | Tragic $39,012 |
| Salvadorans | 0.5 /100 | #266 | Tragic $38,858 |
| Immigrants | Zaire | 0.4 /100 | #267 | Tragic $38,848 |