Hispanic or Latino vs Lumbee Family Poverty
COMPARE
Hispanic or Latino
Lumbee
Family Poverty
Family Poverty Comparison
Hispanics or Latinos
Lumbee
12.0%
FAMILY POVERTY
0.0/ 100
METRIC RATING
309th/ 347
METRIC RANK
17.0%
FAMILY POVERTY
0.0/ 100
METRIC RATING
341st/ 347
METRIC RANK
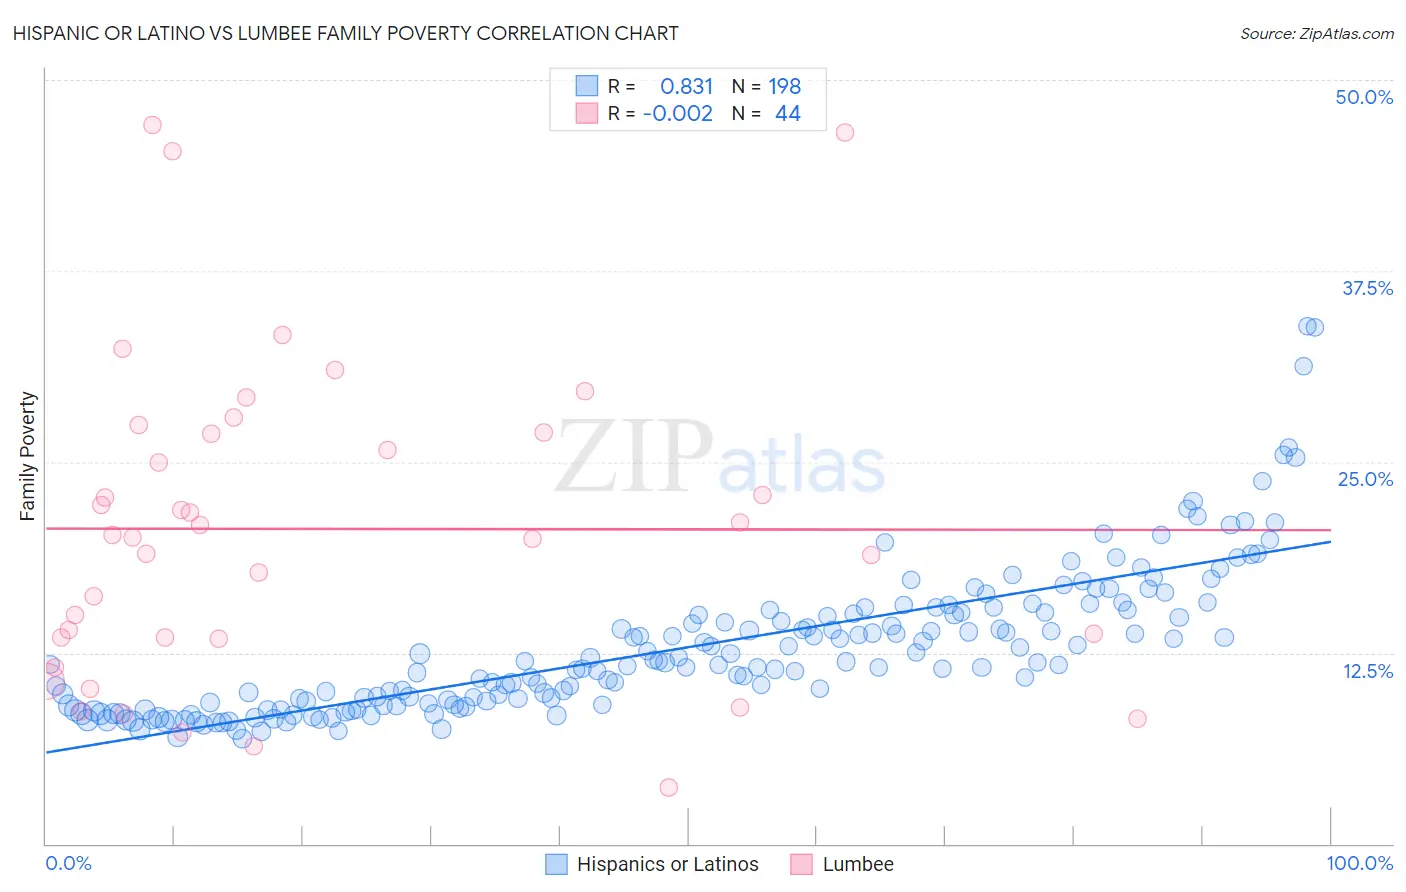
Hispanic or Latino vs Lumbee Family Poverty Correlation Chart
The statistical analysis conducted on geographies consisting of 570,393,322 people shows a very strong positive correlation between the proportion of Hispanics or Latinos and poverty level among families in the United States with a correlation coefficient (R) of 0.831 and weighted average of 12.0%. Similarly, the statistical analysis conducted on geographies consisting of 92,238,507 people shows no correlation between the proportion of Lumbee and poverty level among families in the United States with a correlation coefficient (R) of -0.002 and weighted average of 17.0%, a difference of 42.2%.
Family Poverty Correlation Summary
| Measurement | Hispanic or Latino | Lumbee |
| Minimum | 6.9% | 3.7% |
| Maximum | 33.9% | 47.0% |
| Range | 27.0% | 43.3% |
| Mean | 12.8% | 20.6% |
| Median | 11.7% | 20.2% |
| Interquartile 25% (IQ1) | 9.1% | 13.5% |
| Interquartile 75% (IQ3) | 15.0% | 26.9% |
| Interquartile Range (IQR) | 6.0% | 13.4% |
| Standard Deviation (Sample) | 4.8% | 10.4% |
| Standard Deviation (Population) | 4.7% | 10.3% |
Similar Demographics by Family Poverty
Demographics Similar to Hispanics or Latinos by Family Poverty
In terms of family poverty, the demographic groups most similar to Hispanics or Latinos are Immigrants from Guatemala (12.0%, a difference of 0.0%), Seminole (11.9%, a difference of 0.45%), Immigrants from Congo (11.9%, a difference of 0.50%), Cajun (11.9%, a difference of 0.61%), and Ute (12.1%, a difference of 0.84%).
| Demographics | Rating | Rank | Family Poverty |
| Guatemalans | 0.0 /100 | #302 | Tragic 11.7% |
| Africans | 0.0 /100 | #303 | Tragic 11.8% |
| Immigrants | Latin America | 0.0 /100 | #304 | Tragic 11.8% |
| Mexicans | 0.0 /100 | #305 | Tragic 11.8% |
| Cajuns | 0.0 /100 | #306 | Tragic 11.9% |
| Immigrants | Congo | 0.0 /100 | #307 | Tragic 11.9% |
| Seminole | 0.0 /100 | #308 | Tragic 11.9% |
| Hispanics or Latinos | 0.0 /100 | #309 | Tragic 12.0% |
| Immigrants | Guatemala | 0.0 /100 | #310 | Tragic 12.0% |
| Ute | 0.0 /100 | #311 | Tragic 12.1% |
| Immigrants | Central America | 0.0 /100 | #312 | Tragic 12.1% |
| Immigrants | Caribbean | 0.0 /100 | #313 | Tragic 12.2% |
| Kiowa | 0.0 /100 | #314 | Tragic 12.2% |
| Immigrants | Mexico | 0.0 /100 | #315 | Tragic 12.3% |
| Hondurans | 0.0 /100 | #316 | Tragic 12.4% |
Demographics Similar to Lumbee by Family Poverty
In terms of family poverty, the demographic groups most similar to Lumbee are Pueblo (17.0%, a difference of 0.070%), Yuman (16.6%, a difference of 2.1%), Immigrants from Yemen (17.5%, a difference of 2.8%), Crow (16.1%, a difference of 5.5%), and Hopi (15.9%, a difference of 6.7%).
| Demographics | Rating | Rank | Family Poverty |
| Immigrants | Dominican Republic | 0.0 /100 | #333 | Tragic 14.4% |
| Houma | 0.0 /100 | #334 | Tragic 14.6% |
| Apache | 0.0 /100 | #335 | Tragic 14.7% |
| Sioux | 0.0 /100 | #336 | Tragic 15.9% |
| Hopi | 0.0 /100 | #337 | Tragic 15.9% |
| Crow | 0.0 /100 | #338 | Tragic 16.1% |
| Yuman | 0.0 /100 | #339 | Tragic 16.6% |
| Pueblo | 0.0 /100 | #340 | Tragic 17.0% |
| Lumbee | 0.0 /100 | #341 | Tragic 17.0% |
| Immigrants | Yemen | 0.0 /100 | #342 | Tragic 17.5% |
| Pima | 0.0 /100 | #343 | Tragic 18.4% |
| Yup'ik | 0.0 /100 | #344 | Tragic 18.7% |
| Navajo | 0.0 /100 | #345 | Tragic 18.8% |
| Puerto Ricans | 0.0 /100 | #346 | Tragic 20.3% |
| Tohono O'odham | 0.0 /100 | #347 | Tragic 20.4% |