Serbian vs Lumbee Family Poverty
COMPARE
Serbian
Lumbee
Family Poverty
Family Poverty Comparison
Serbians
Lumbee
8.0%
FAMILY POVERTY
97.2/ 100
METRIC RATING
88th/ 347
METRIC RANK
17.0%
FAMILY POVERTY
0.0/ 100
METRIC RATING
341st/ 347
METRIC RANK
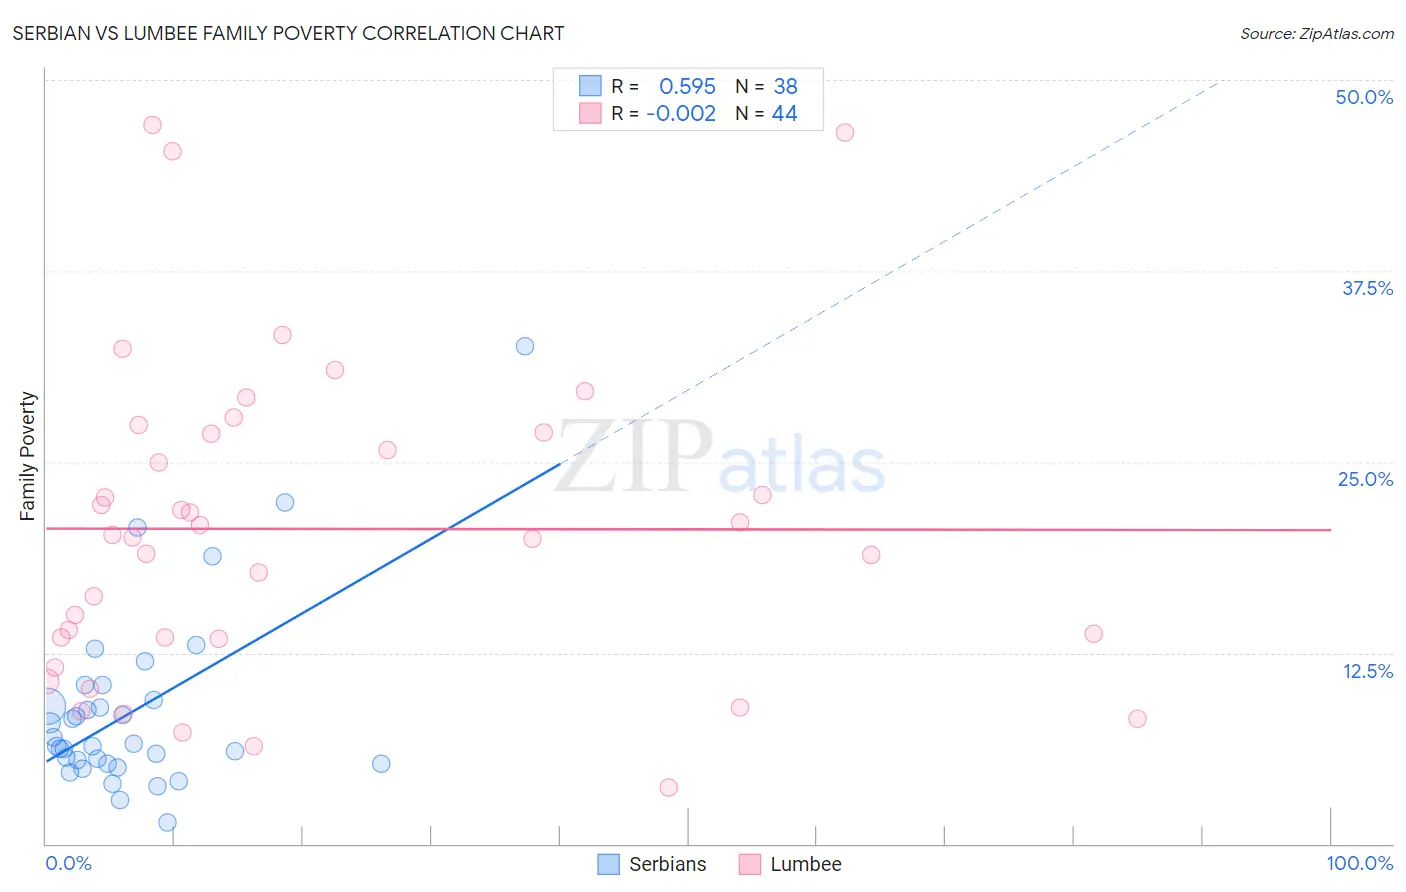
Serbian vs Lumbee Family Poverty Correlation Chart
The statistical analysis conducted on geographies consisting of 267,119,010 people shows a substantial positive correlation between the proportion of Serbians and poverty level among families in the United States with a correlation coefficient (R) of 0.595 and weighted average of 8.0%. Similarly, the statistical analysis conducted on geographies consisting of 92,238,507 people shows no correlation between the proportion of Lumbee and poverty level among families in the United States with a correlation coefficient (R) of -0.002 and weighted average of 17.0%, a difference of 113.6%.
Family Poverty Correlation Summary
| Measurement | Serbian | Lumbee |
| Minimum | 1.4% | 3.7% |
| Maximum | 32.6% | 47.0% |
| Range | 31.2% | 43.3% |
| Mean | 8.7% | 20.6% |
| Median | 6.5% | 20.2% |
| Interquartile 25% (IQ1) | 5.3% | 13.5% |
| Interquartile 75% (IQ3) | 9.4% | 26.9% |
| Interquartile Range (IQR) | 4.1% | 13.4% |
| Standard Deviation (Sample) | 6.1% | 10.4% |
| Standard Deviation (Population) | 6.0% | 10.3% |
Similar Demographics by Family Poverty
Demographics Similar to Serbians by Family Poverty
In terms of family poverty, the demographic groups most similar to Serbians are Belgian (8.0%, a difference of 0.070%), Scottish (7.9%, a difference of 0.15%), Immigrants from Denmark (8.0%, a difference of 0.15%), Immigrants from England (8.0%, a difference of 0.15%), and Immigrants from Asia (7.9%, a difference of 0.20%).
| Demographics | Rating | Rank | Family Poverty |
| Irish | 97.8 /100 | #81 | Exceptional 7.9% |
| Immigrants | Poland | 97.8 /100 | #82 | Exceptional 7.9% |
| Slovaks | 97.7 /100 | #83 | Exceptional 7.9% |
| British | 97.5 /100 | #84 | Exceptional 7.9% |
| Immigrants | Asia | 97.4 /100 | #85 | Exceptional 7.9% |
| Scottish | 97.3 /100 | #86 | Exceptional 7.9% |
| Belgians | 97.3 /100 | #87 | Exceptional 8.0% |
| Serbians | 97.2 /100 | #88 | Exceptional 8.0% |
| Immigrants | Denmark | 97.1 /100 | #89 | Exceptional 8.0% |
| Immigrants | England | 97.1 /100 | #90 | Exceptional 8.0% |
| Immigrants | Italy | 97.0 /100 | #91 | Exceptional 8.0% |
| Czechoslovakians | 96.8 /100 | #92 | Exceptional 8.0% |
| Tlingit-Haida | 96.7 /100 | #93 | Exceptional 8.0% |
| Immigrants | Pakistan | 96.6 /100 | #94 | Exceptional 8.0% |
| Immigrants | Philippines | 96.5 /100 | #95 | Exceptional 8.0% |
Demographics Similar to Lumbee by Family Poverty
In terms of family poverty, the demographic groups most similar to Lumbee are Pueblo (17.0%, a difference of 0.070%), Yuman (16.6%, a difference of 2.1%), Immigrants from Yemen (17.5%, a difference of 2.8%), Crow (16.1%, a difference of 5.5%), and Hopi (15.9%, a difference of 6.7%).
| Demographics | Rating | Rank | Family Poverty |
| Immigrants | Dominican Republic | 0.0 /100 | #333 | Tragic 14.4% |
| Houma | 0.0 /100 | #334 | Tragic 14.6% |
| Apache | 0.0 /100 | #335 | Tragic 14.7% |
| Sioux | 0.0 /100 | #336 | Tragic 15.9% |
| Hopi | 0.0 /100 | #337 | Tragic 15.9% |
| Crow | 0.0 /100 | #338 | Tragic 16.1% |
| Yuman | 0.0 /100 | #339 | Tragic 16.6% |
| Pueblo | 0.0 /100 | #340 | Tragic 17.0% |
| Lumbee | 0.0 /100 | #341 | Tragic 17.0% |
| Immigrants | Yemen | 0.0 /100 | #342 | Tragic 17.5% |
| Pima | 0.0 /100 | #343 | Tragic 18.4% |
| Yup'ik | 0.0 /100 | #344 | Tragic 18.7% |
| Navajo | 0.0 /100 | #345 | Tragic 18.8% |
| Puerto Ricans | 0.0 /100 | #346 | Tragic 20.3% |
| Tohono O'odham | 0.0 /100 | #347 | Tragic 20.4% |