Japanese vs Filipino Married-Couple Family Poverty
COMPARE
Japanese
Filipino
Married-Couple Family Poverty
Married-Couple Family Poverty Comparison
Japanese
Filipinos
5.6%
MARRIED-COUPLE FAMILY POVERTY
9.8/ 100
METRIC RATING
219th/ 347
METRIC RANK
4.0%
MARRIED-COUPLE FAMILY POVERTY
100.0/ 100
METRIC RATING
17th/ 347
METRIC RANK
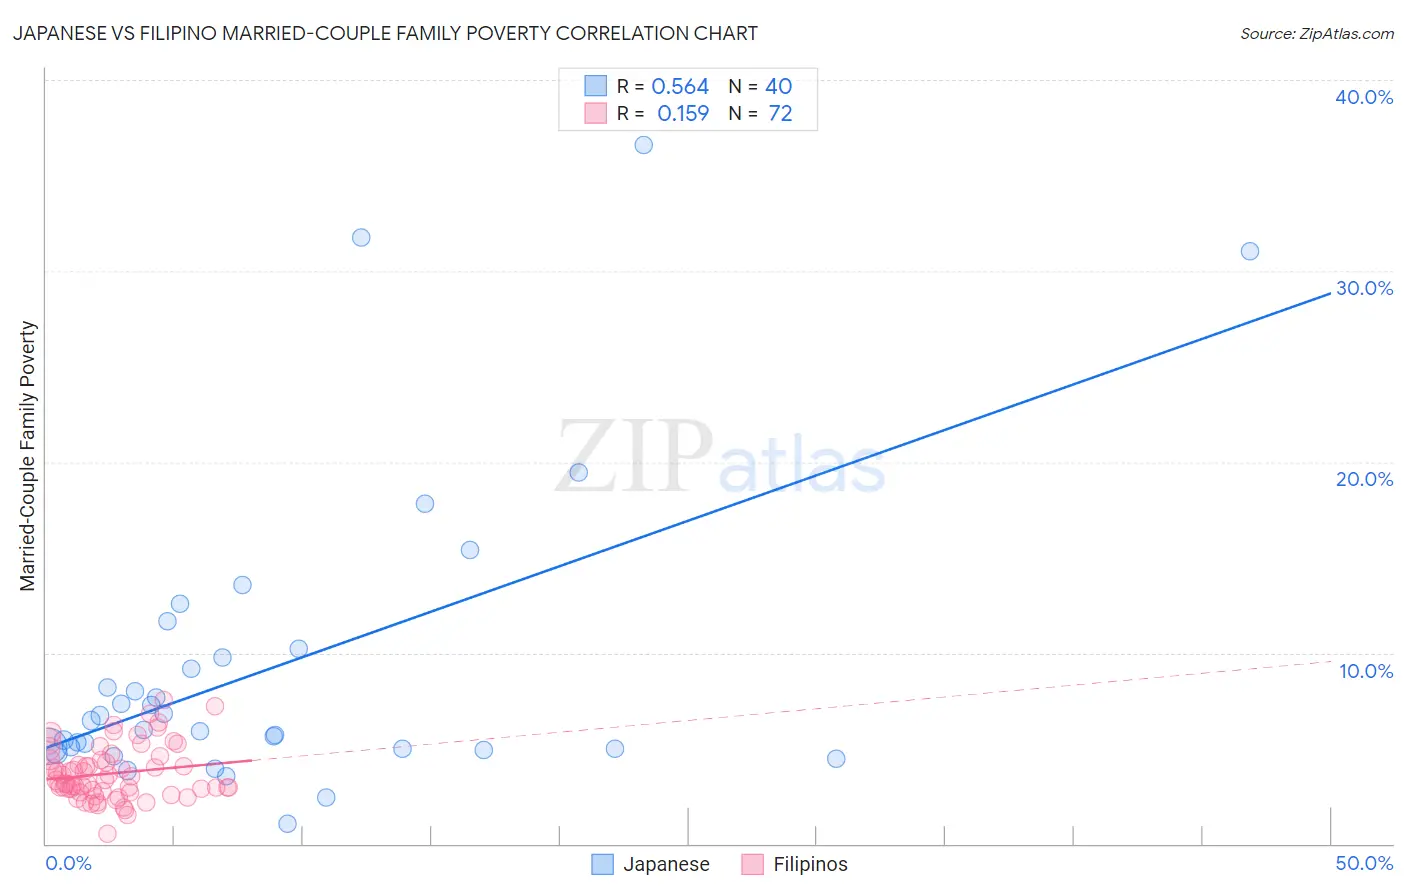
Japanese vs Filipino Married-Couple Family Poverty Correlation Chart
The statistical analysis conducted on geographies consisting of 247,969,020 people shows a substantial positive correlation between the proportion of Japanese and poverty level among married-couple families in the United States with a correlation coefficient (R) of 0.564 and weighted average of 5.6%. Similarly, the statistical analysis conducted on geographies consisting of 252,645,683 people shows a poor positive correlation between the proportion of Filipinos and poverty level among married-couple families in the United States with a correlation coefficient (R) of 0.159 and weighted average of 4.0%, a difference of 37.6%.
Married-Couple Family Poverty Correlation Summary
| Measurement | Japanese | Filipino |
| Minimum | 1.1% | 0.49% |
| Maximum | 36.6% | 7.5% |
| Range | 35.5% | 7.0% |
| Mean | 9.3% | 3.7% |
| Median | 6.2% | 3.3% |
| Interquartile 25% (IQ1) | 5.0% | 2.8% |
| Interquartile 75% (IQ3) | 10.0% | 4.4% |
| Interquartile Range (IQR) | 5.0% | 1.6% |
| Standard Deviation (Sample) | 8.0% | 1.4% |
| Standard Deviation (Population) | 7.9% | 1.4% |
Similar Demographics by Married-Couple Family Poverty
Demographics Similar to Japanese by Married-Couple Family Poverty
In terms of married-couple family poverty, the demographic groups most similar to Japanese are Colombian (5.6%, a difference of 0.19%), Panamanian (5.6%, a difference of 0.21%), Afghan (5.5%, a difference of 0.40%), Immigrants from Nigeria (5.5%, a difference of 0.42%), and Potawatomi (5.5%, a difference of 0.71%).
| Demographics | Rating | Rank | Married-Couple Family Poverty |
| Immigrants | Thailand | 14.0 /100 | #212 | Poor 5.5% |
| Immigrants | Liberia | 13.3 /100 | #213 | Poor 5.5% |
| Iroquois | 13.1 /100 | #214 | Poor 5.5% |
| Armenians | 12.8 /100 | #215 | Poor 5.5% |
| Potawatomi | 12.4 /100 | #216 | Poor 5.5% |
| Immigrants | Nigeria | 11.3 /100 | #217 | Poor 5.5% |
| Afghans | 11.2 /100 | #218 | Poor 5.5% |
| Japanese | 9.8 /100 | #219 | Tragic 5.6% |
| Colombians | 9.2 /100 | #220 | Tragic 5.6% |
| Panamanians | 9.2 /100 | #221 | Tragic 5.6% |
| Cajuns | 6.9 /100 | #222 | Tragic 5.6% |
| Immigrants | Fiji | 6.7 /100 | #223 | Tragic 5.6% |
| Sudanese | 6.4 /100 | #224 | Tragic 5.6% |
| Immigrants | Cambodia | 6.1 /100 | #225 | Tragic 5.6% |
| South Americans | 5.7 /100 | #226 | Tragic 5.6% |
Demographics Similar to Filipinos by Married-Couple Family Poverty
In terms of married-couple family poverty, the demographic groups most similar to Filipinos are Italian (4.0%, a difference of 0.010%), German (4.0%, a difference of 0.030%), Polish (4.0%, a difference of 0.30%), Slovak (4.0%, a difference of 0.33%), and Czech (4.0%, a difference of 0.37%).
| Demographics | Rating | Rank | Married-Couple Family Poverty |
| Carpatho Rusyns | 100.0 /100 | #10 | Exceptional 3.9% |
| Lithuanians | 100.0 /100 | #11 | Exceptional 4.0% |
| Bulgarians | 100.0 /100 | #12 | Exceptional 4.0% |
| Czechs | 100.0 /100 | #13 | Exceptional 4.0% |
| Slovaks | 100.0 /100 | #14 | Exceptional 4.0% |
| Poles | 100.0 /100 | #15 | Exceptional 4.0% |
| Germans | 100.0 /100 | #16 | Exceptional 4.0% |
| Filipinos | 100.0 /100 | #17 | Exceptional 4.0% |
| Italians | 100.0 /100 | #18 | Exceptional 4.0% |
| Immigrants | Ireland | 99.9 /100 | #19 | Exceptional 4.1% |
| Maltese | 99.9 /100 | #20 | Exceptional 4.1% |
| Zimbabweans | 99.9 /100 | #21 | Exceptional 4.1% |
| Immigrants | Singapore | 99.9 /100 | #22 | Exceptional 4.1% |
| Bhutanese | 99.9 /100 | #23 | Exceptional 4.1% |
| Eastern Europeans | 99.9 /100 | #24 | Exceptional 4.1% |