Immigrants from Guatemala vs Osage Poverty
COMPARE
Immigrants from Guatemala
Osage
Poverty
Poverty Comparison
Immigrants from Guatemala
Osage
15.5%
POVERTY
0.0/ 100
METRIC RATING
305th/ 347
METRIC RANK
13.6%
POVERTY
1.5/ 100
METRIC RATING
229th/ 347
METRIC RANK
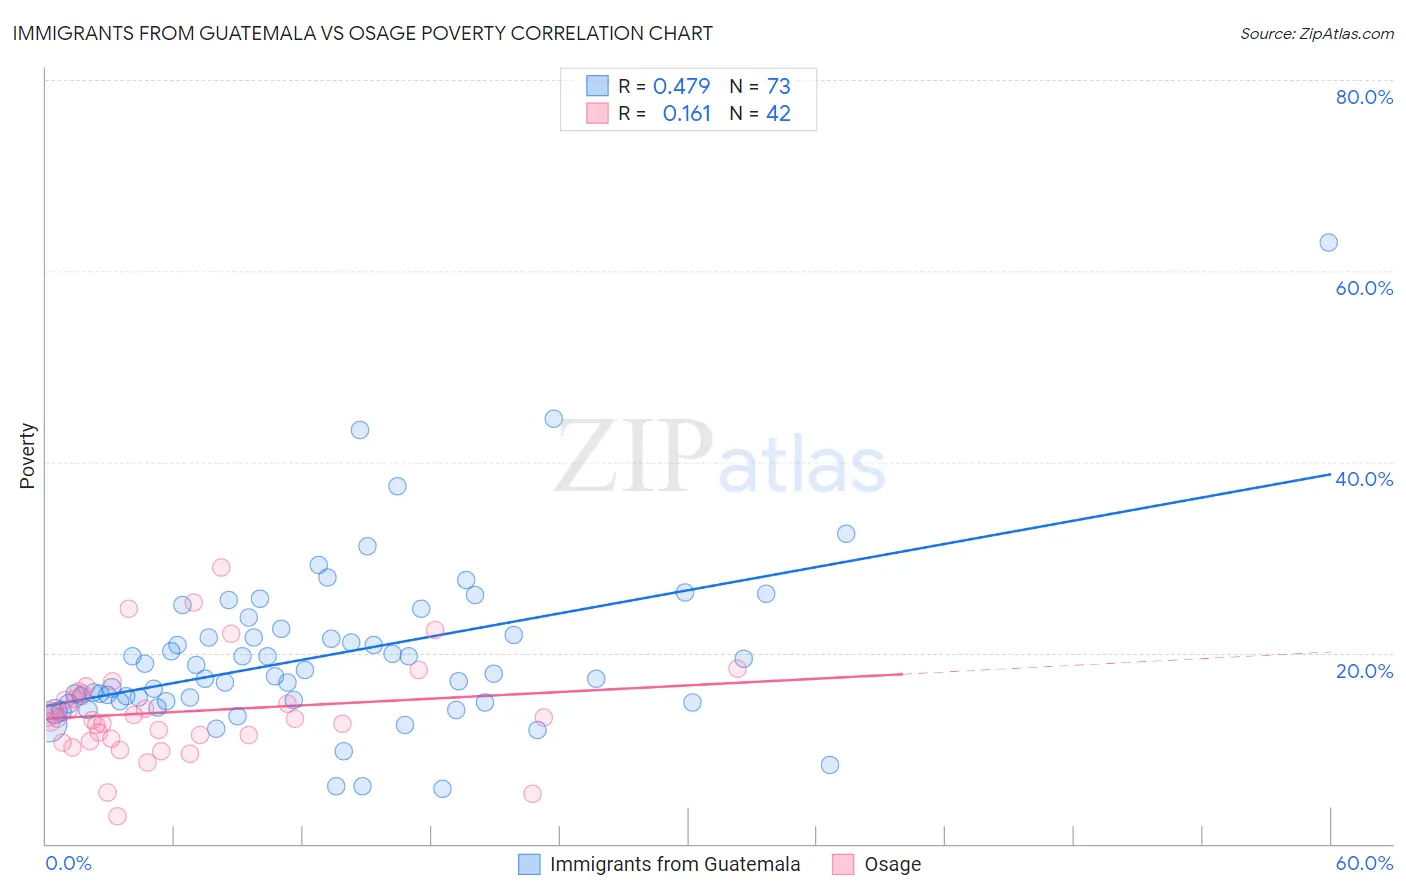
Immigrants from Guatemala vs Osage Poverty Correlation Chart
The statistical analysis conducted on geographies consisting of 377,145,894 people shows a moderate positive correlation between the proportion of Immigrants from Guatemala and poverty level in the United States with a correlation coefficient (R) of 0.479 and weighted average of 15.5%. Similarly, the statistical analysis conducted on geographies consisting of 91,797,306 people shows a poor positive correlation between the proportion of Osage and poverty level in the United States with a correlation coefficient (R) of 0.161 and weighted average of 13.6%, a difference of 14.3%.
Poverty Correlation Summary
| Measurement | Immigrants from Guatemala | Osage |
| Minimum | 5.8% | 2.8% |
| Maximum | 62.9% | 28.9% |
| Range | 57.2% | 26.1% |
| Mean | 19.7% | 13.8% |
| Median | 17.5% | 13.1% |
| Interquartile 25% (IQ1) | 14.8% | 10.9% |
| Interquartile 75% (IQ3) | 22.2% | 15.7% |
| Interquartile Range (IQR) | 7.3% | 4.7% |
| Standard Deviation (Sample) | 8.9% | 5.2% |
| Standard Deviation (Population) | 8.9% | 5.1% |
Similar Demographics by Poverty
Demographics Similar to Immigrants from Guatemala by Poverty
In terms of poverty, the demographic groups most similar to Immigrants from Guatemala are Immigrants from Mexico (15.5%, a difference of 0.030%), Immigrants from Caribbean (15.5%, a difference of 0.12%), Creek (15.6%, a difference of 0.44%), African (15.6%, a difference of 0.51%), and Somali (15.4%, a difference of 0.61%).
| Demographics | Rating | Rank | Poverty |
| Immigrants | Senegal | 0.0 /100 | #298 | Tragic 15.3% |
| Senegalese | 0.0 /100 | #299 | Tragic 15.3% |
| Immigrants | Central America | 0.0 /100 | #300 | Tragic 15.4% |
| Bahamians | 0.0 /100 | #301 | Tragic 15.4% |
| Somalis | 0.0 /100 | #302 | Tragic 15.4% |
| Immigrants | Caribbean | 0.0 /100 | #303 | Tragic 15.5% |
| Immigrants | Mexico | 0.0 /100 | #304 | Tragic 15.5% |
| Immigrants | Guatemala | 0.0 /100 | #305 | Tragic 15.5% |
| Creek | 0.0 /100 | #306 | Tragic 15.6% |
| Africans | 0.0 /100 | #307 | Tragic 15.6% |
| Choctaw | 0.0 /100 | #308 | Tragic 15.6% |
| Seminole | 0.0 /100 | #309 | Tragic 15.6% |
| Dutch West Indians | 0.0 /100 | #310 | Tragic 15.6% |
| Chippewa | 0.0 /100 | #311 | Tragic 15.7% |
| Cajuns | 0.0 /100 | #312 | Tragic 15.7% |
Demographics Similar to Osage by Poverty
In terms of poverty, the demographic groups most similar to Osage are Alaskan Athabascan (13.6%, a difference of 0.060%), Nigerian (13.6%, a difference of 0.22%), Immigrants from Nigeria (13.5%, a difference of 0.24%), Alaska Native (13.5%, a difference of 0.69%), and Marshallese (13.4%, a difference of 0.85%).
| Demographics | Rating | Rank | Poverty |
| Immigrants | Micronesia | 2.6 /100 | #222 | Tragic 13.4% |
| Immigrants | Africa | 2.5 /100 | #223 | Tragic 13.4% |
| Immigrants | Eritrea | 2.4 /100 | #224 | Tragic 13.4% |
| German Russians | 2.2 /100 | #225 | Tragic 13.4% |
| Marshallese | 2.2 /100 | #226 | Tragic 13.4% |
| Alaska Natives | 2.1 /100 | #227 | Tragic 13.5% |
| Immigrants | Nigeria | 1.7 /100 | #228 | Tragic 13.5% |
| Osage | 1.5 /100 | #229 | Tragic 13.6% |
| Alaskan Athabascans | 1.5 /100 | #230 | Tragic 13.6% |
| Nigerians | 1.4 /100 | #231 | Tragic 13.6% |
| Fijians | 0.8 /100 | #232 | Tragic 13.7% |
| Immigrants | Saudi Arabia | 0.8 /100 | #233 | Tragic 13.8% |
| Immigrants | Laos | 0.7 /100 | #234 | Tragic 13.8% |
| Cubans | 0.6 /100 | #235 | Tragic 13.9% |
| Immigrants | Armenia | 0.5 /100 | #236 | Tragic 13.9% |