Jamaican vs Osage In Labor Force | Age 30-34
COMPARE
Jamaican
Osage
In Labor Force | Age 30-34
In Labor Force | Age 30-34 Comparison
Jamaicans
Osage
84.3%
IN LABOR FORCE | AGE 30-34
8.8/ 100
METRIC RATING
209th/ 347
METRIC RANK
82.3%
IN LABOR FORCE | AGE 30-34
0.0/ 100
METRIC RATING
305th/ 347
METRIC RANK
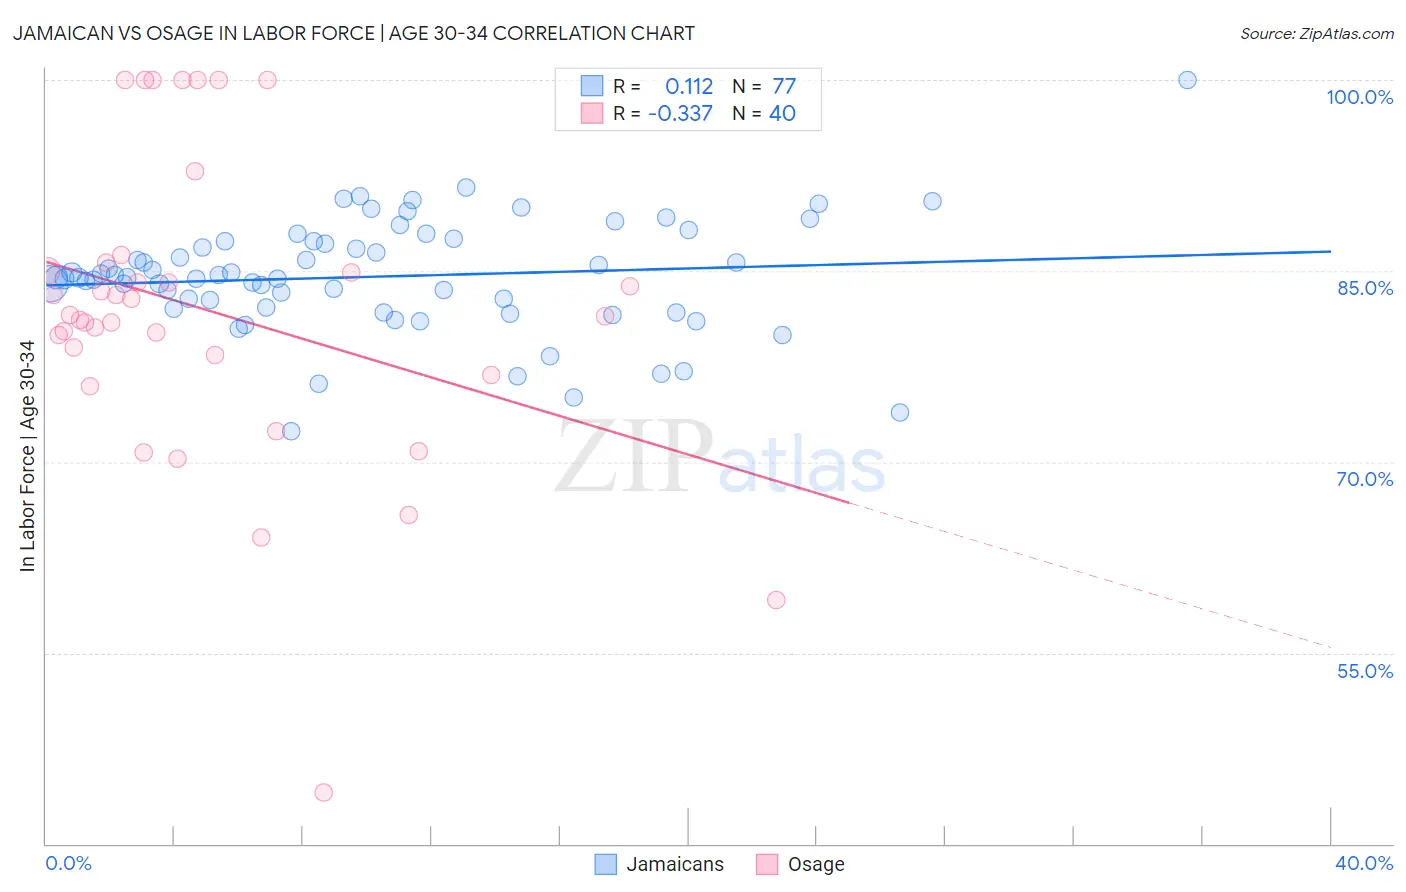
Jamaican vs Osage In Labor Force | Age 30-34 Correlation Chart
The statistical analysis conducted on geographies consisting of 367,736,864 people shows a poor positive correlation between the proportion of Jamaicans and labor force participation rate among population between the ages 30 and 34 in the United States with a correlation coefficient (R) of 0.112 and weighted average of 84.3%. Similarly, the statistical analysis conducted on geographies consisting of 91,795,365 people shows a mild negative correlation between the proportion of Osage and labor force participation rate among population between the ages 30 and 34 in the United States with a correlation coefficient (R) of -0.337 and weighted average of 82.3%, a difference of 2.5%.
In Labor Force | Age 30-34 Correlation Summary
| Measurement | Jamaican | Osage |
| Minimum | 72.4% | 44.0% |
| Maximum | 100.0% | 100.0% |
| Range | 27.6% | 56.0% |
| Mean | 84.6% | 81.8% |
| Median | 84.5% | 81.5% |
| Interquartile 25% (IQ1) | 82.1% | 77.6% |
| Interquartile 75% (IQ3) | 87.3% | 85.4% |
| Interquartile Range (IQR) | 5.3% | 7.8% |
| Standard Deviation (Sample) | 4.5% | 12.0% |
| Standard Deviation (Population) | 4.4% | 11.8% |
Similar Demographics by In Labor Force | Age 30-34
Demographics Similar to Jamaicans by In Labor Force | Age 30-34
In terms of in labor force | age 30-34, the demographic groups most similar to Jamaicans are Arab (84.3%, a difference of 0.0%), Indonesian (84.3%, a difference of 0.0%), Japanese (84.3%, a difference of 0.0%), Bangladeshi (84.3%, a difference of 0.010%), and Immigrants from Western Asia (84.3%, a difference of 0.010%).
| Demographics | Rating | Rank | In Labor Force | Age 30-34 |
| Immigrants | West Indies | 18.1 /100 | #202 | Poor 84.5% |
| Canadians | 15.4 /100 | #203 | Poor 84.4% |
| Ecuadorians | 14.2 /100 | #204 | Poor 84.4% |
| French | 13.8 /100 | #205 | Poor 84.4% |
| Lebanese | 10.6 /100 | #206 | Poor 84.4% |
| Bangladeshis | 9.4 /100 | #207 | Tragic 84.3% |
| Arabs | 8.9 /100 | #208 | Tragic 84.3% |
| Jamaicans | 8.8 /100 | #209 | Tragic 84.3% |
| Indonesians | 8.8 /100 | #210 | Tragic 84.3% |
| Japanese | 8.8 /100 | #211 | Tragic 84.3% |
| Immigrants | Western Asia | 8.2 /100 | #212 | Tragic 84.3% |
| Immigrants | Jamaica | 7.9 /100 | #213 | Tragic 84.3% |
| Immigrants | Germany | 7.2 /100 | #214 | Tragic 84.3% |
| Europeans | 7.2 /100 | #215 | Tragic 84.3% |
| Immigrants | Ecuador | 7.1 /100 | #216 | Tragic 84.3% |
Demographics Similar to Osage by In Labor Force | Age 30-34
In terms of in labor force | age 30-34, the demographic groups most similar to Osage are Spanish American Indian (82.2%, a difference of 0.020%), Menominee (82.2%, a difference of 0.070%), Tlingit-Haida (82.3%, a difference of 0.080%), Immigrants from Micronesia (82.4%, a difference of 0.16%), and Ottawa (82.4%, a difference of 0.17%).
| Demographics | Rating | Rank | In Labor Force | Age 30-34 |
| Aleuts | 0.0 /100 | #298 | Tragic 82.6% |
| Immigrants | Central America | 0.0 /100 | #299 | Tragic 82.5% |
| Hmong | 0.0 /100 | #300 | Tragic 82.4% |
| Hispanics or Latinos | 0.0 /100 | #301 | Tragic 82.4% |
| Ottawa | 0.0 /100 | #302 | Tragic 82.4% |
| Immigrants | Micronesia | 0.0 /100 | #303 | Tragic 82.4% |
| Tlingit-Haida | 0.0 /100 | #304 | Tragic 82.3% |
| Osage | 0.0 /100 | #305 | Tragic 82.3% |
| Spanish American Indians | 0.0 /100 | #306 | Tragic 82.2% |
| Menominee | 0.0 /100 | #307 | Tragic 82.2% |
| Puget Sound Salish | 0.0 /100 | #308 | Tragic 82.1% |
| Immigrants | Mexico | 0.0 /100 | #309 | Tragic 82.0% |
| Cajuns | 0.0 /100 | #310 | Tragic 82.0% |
| Chickasaw | 0.0 /100 | #311 | Tragic 81.9% |
| Mexicans | 0.0 /100 | #312 | Tragic 81.9% |