Jamaican vs Indian (Asian) Single Female Poverty
COMPARE
Jamaican
Indian (Asian)
Single Female Poverty
Single Female Poverty Comparison
Jamaicans
Indians (Asian)
21.6%
SINGLE FEMALE POVERTY
14.0/ 100
METRIC RATING
212th/ 347
METRIC RANK
17.9%
SINGLE FEMALE POVERTY
100.0/ 100
METRIC RATING
15th/ 347
METRIC RANK
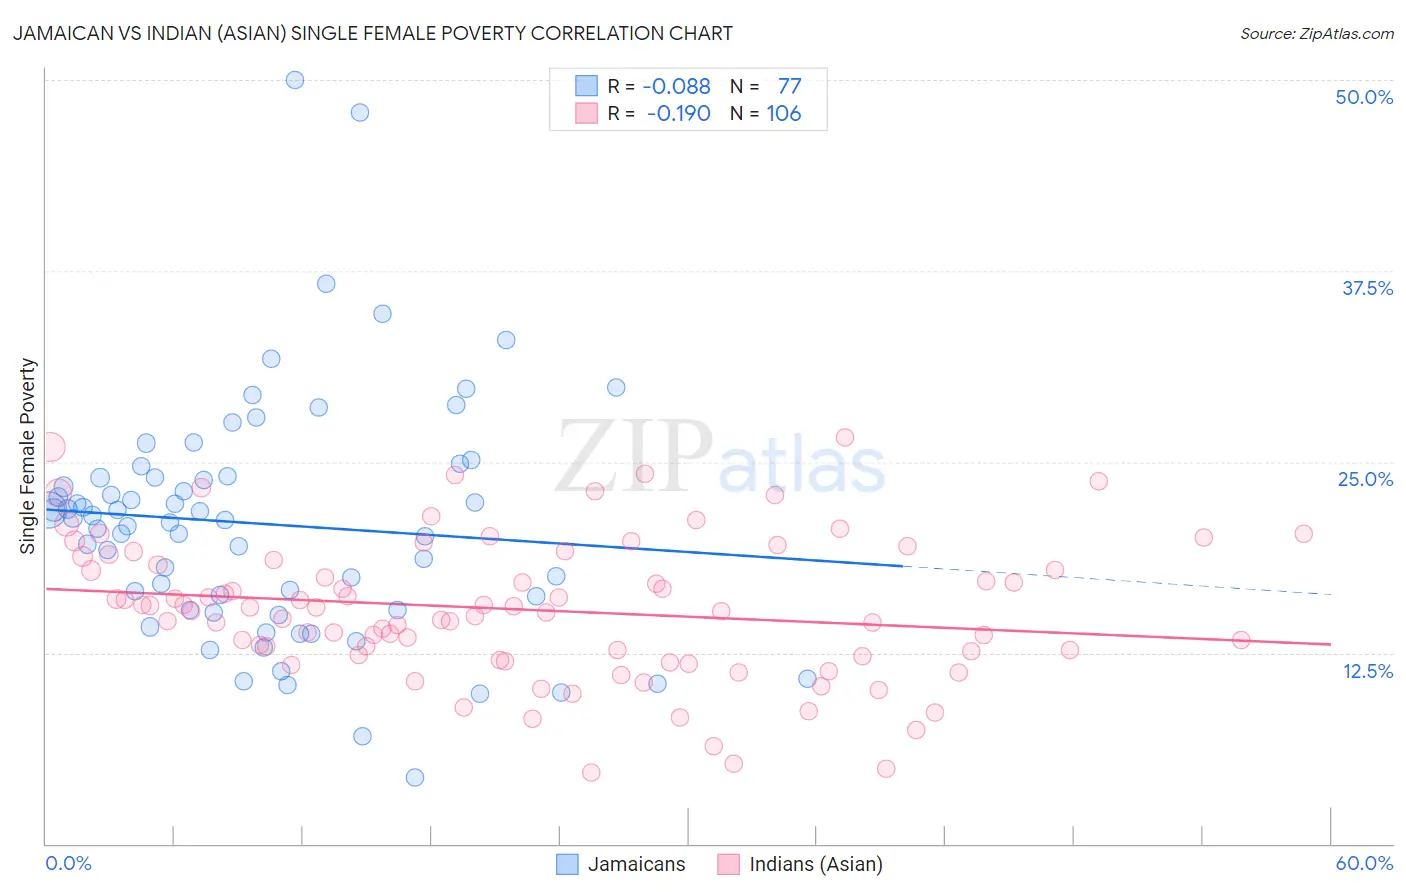
Jamaican vs Indian (Asian) Single Female Poverty Correlation Chart
The statistical analysis conducted on geographies consisting of 363,369,042 people shows a slight negative correlation between the proportion of Jamaicans and poverty level among single females in the United States with a correlation coefficient (R) of -0.088 and weighted average of 21.6%. Similarly, the statistical analysis conducted on geographies consisting of 483,253,971 people shows a poor negative correlation between the proportion of Indians (Asian) and poverty level among single females in the United States with a correlation coefficient (R) of -0.190 and weighted average of 17.9%, a difference of 20.3%.
Single Female Poverty Correlation Summary
| Measurement | Jamaican | Indian (Asian) |
| Minimum | 4.4% | 4.6% |
| Maximum | 50.0% | 26.6% |
| Range | 45.6% | 21.9% |
| Mean | 20.9% | 15.3% |
| Median | 21.2% | 15.4% |
| Interquartile 25% (IQ1) | 15.3% | 12.4% |
| Interquartile 75% (IQ3) | 24.0% | 18.6% |
| Interquartile Range (IQR) | 8.7% | 6.2% |
| Standard Deviation (Sample) | 7.9% | 4.6% |
| Standard Deviation (Population) | 7.9% | 4.6% |
Similar Demographics by Single Female Poverty
Demographics Similar to Jamaicans by Single Female Poverty
In terms of single female poverty, the demographic groups most similar to Jamaicans are Icelander (21.6%, a difference of 0.010%), Guamanian/Chamorro (21.6%, a difference of 0.030%), Immigrants from Panama (21.6%, a difference of 0.050%), Immigrants from Nicaragua (21.6%, a difference of 0.090%), and Immigrants from Eastern Africa (21.6%, a difference of 0.14%).
| Demographics | Rating | Rank | Single Female Poverty |
| Finns | 16.2 /100 | #205 | Poor 21.5% |
| Belgians | 16.1 /100 | #206 | Poor 21.5% |
| Ghanaians | 15.7 /100 | #207 | Poor 21.6% |
| Haitians | 15.4 /100 | #208 | Poor 21.6% |
| Immigrants | Eastern Africa | 15.1 /100 | #209 | Poor 21.6% |
| Immigrants | Panama | 14.4 /100 | #210 | Poor 21.6% |
| Icelanders | 14.0 /100 | #211 | Poor 21.6% |
| Jamaicans | 14.0 /100 | #212 | Poor 21.6% |
| Guamanians/Chamorros | 13.7 /100 | #213 | Poor 21.6% |
| Immigrants | Nicaragua | 13.3 /100 | #214 | Poor 21.6% |
| Ecuadorians | 12.3 /100 | #215 | Poor 21.6% |
| Immigrants | Barbados | 12.2 /100 | #216 | Poor 21.7% |
| Immigrants | St. Vincent and the Grenadines | 11.7 /100 | #217 | Poor 21.7% |
| Nepalese | 9.7 /100 | #218 | Tragic 21.7% |
| Panamanians | 9.4 /100 | #219 | Tragic 21.7% |
Demographics Similar to Indians (Asian) by Single Female Poverty
In terms of single female poverty, the demographic groups most similar to Indians (Asian) are Bolivian (17.9%, a difference of 0.15%), Iranian (18.0%, a difference of 0.16%), Immigrants from Bolivia (17.8%, a difference of 0.59%), Immigrants from Korea (18.1%, a difference of 0.76%), and Immigrants from South Central Asia (17.8%, a difference of 0.85%).
| Demographics | Rating | Rank | Single Female Poverty |
| Immigrants | Iran | 100.0 /100 | #8 | Exceptional 17.5% |
| Bhutanese | 100.0 /100 | #9 | Exceptional 17.7% |
| Immigrants | Ireland | 100.0 /100 | #10 | Exceptional 17.8% |
| Immigrants | Lithuania | 100.0 /100 | #11 | Exceptional 17.8% |
| Immigrants | South Central Asia | 100.0 /100 | #12 | Exceptional 17.8% |
| Immigrants | Bolivia | 100.0 /100 | #13 | Exceptional 17.8% |
| Bolivians | 100.0 /100 | #14 | Exceptional 17.9% |
| Indians (Asian) | 100.0 /100 | #15 | Exceptional 17.9% |
| Iranians | 100.0 /100 | #16 | Exceptional 18.0% |
| Immigrants | Korea | 100.0 /100 | #17 | Exceptional 18.1% |
| Immigrants | Eastern Asia | 100.0 /100 | #18 | Exceptional 18.1% |
| Immigrants | China | 100.0 /100 | #19 | Exceptional 18.1% |
| Immigrants | Greece | 100.0 /100 | #20 | Exceptional 18.3% |
| Maltese | 100.0 /100 | #21 | Exceptional 18.3% |
| Burmese | 100.0 /100 | #22 | Exceptional 18.3% |