Jamaican vs Immigrants from Laos Single Female Poverty
COMPARE
Jamaican
Immigrants from Laos
Single Female Poverty
Single Female Poverty Comparison
Jamaicans
Immigrants from Laos
21.6%
SINGLE FEMALE POVERTY
14.0/ 100
METRIC RATING
212th/ 347
METRIC RANK
22.9%
SINGLE FEMALE POVERTY
0.3/ 100
METRIC RATING
264th/ 347
METRIC RANK
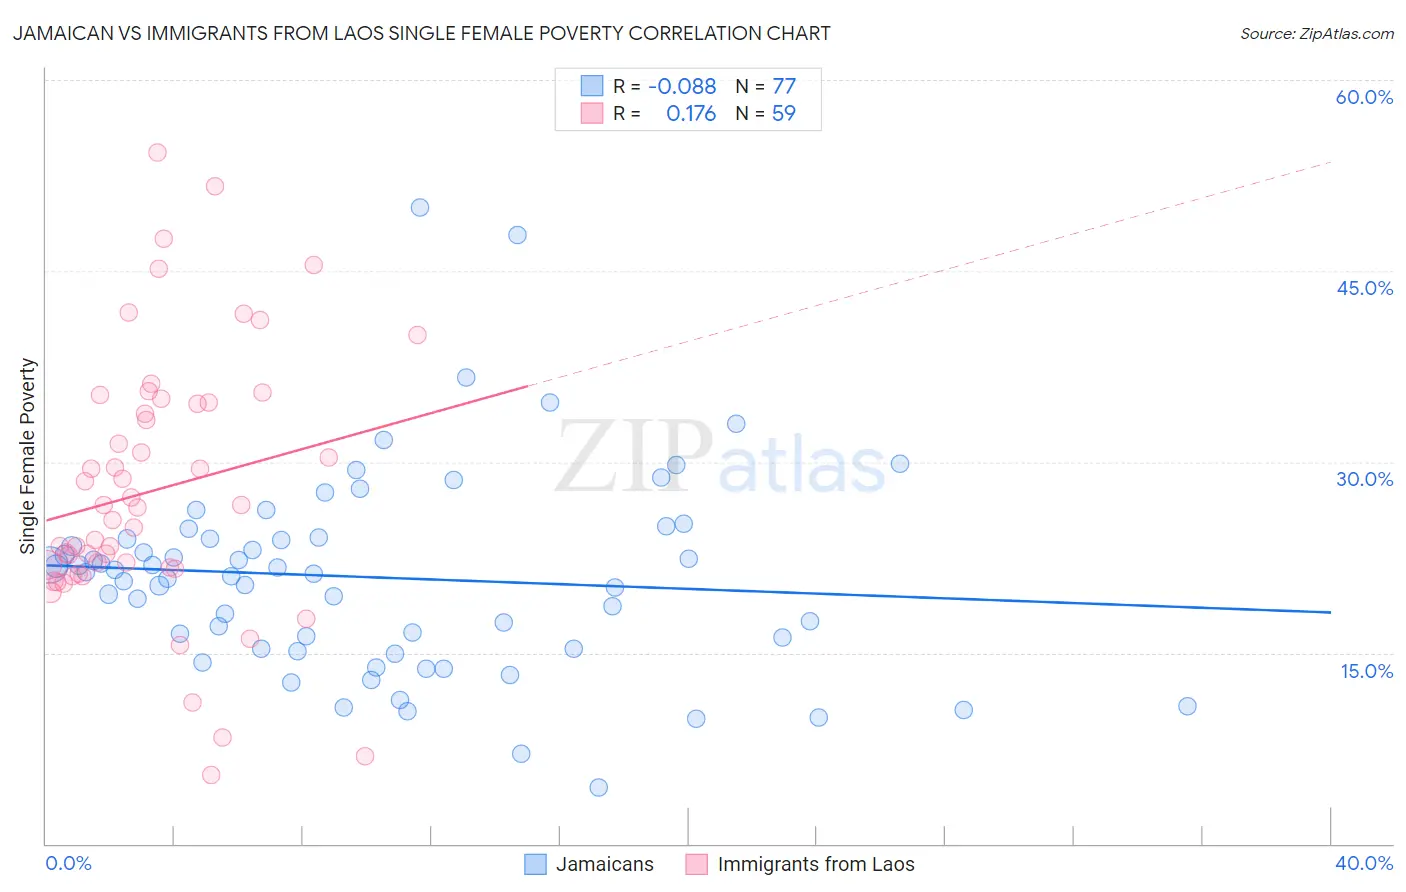
Jamaican vs Immigrants from Laos Single Female Poverty Correlation Chart
The statistical analysis conducted on geographies consisting of 363,369,042 people shows a slight negative correlation between the proportion of Jamaicans and poverty level among single females in the United States with a correlation coefficient (R) of -0.088 and weighted average of 21.6%. Similarly, the statistical analysis conducted on geographies consisting of 200,096,236 people shows a poor positive correlation between the proportion of Immigrants from Laos and poverty level among single females in the United States with a correlation coefficient (R) of 0.176 and weighted average of 22.9%, a difference of 6.2%.
Single Female Poverty Correlation Summary
| Measurement | Jamaican | Immigrants from Laos |
| Minimum | 4.4% | 5.4% |
| Maximum | 50.0% | 54.3% |
| Range | 45.6% | 48.9% |
| Mean | 20.9% | 27.8% |
| Median | 21.2% | 26.4% |
| Interquartile 25% (IQ1) | 15.3% | 21.6% |
| Interquartile 75% (IQ3) | 24.0% | 34.7% |
| Interquartile Range (IQR) | 8.7% | 13.1% |
| Standard Deviation (Sample) | 7.9% | 10.3% |
| Standard Deviation (Population) | 7.9% | 10.2% |
Similar Demographics by Single Female Poverty
Demographics Similar to Jamaicans by Single Female Poverty
In terms of single female poverty, the demographic groups most similar to Jamaicans are Icelander (21.6%, a difference of 0.010%), Guamanian/Chamorro (21.6%, a difference of 0.030%), Immigrants from Panama (21.6%, a difference of 0.050%), Immigrants from Nicaragua (21.6%, a difference of 0.090%), and Immigrants from Eastern Africa (21.6%, a difference of 0.14%).
| Demographics | Rating | Rank | Single Female Poverty |
| Finns | 16.2 /100 | #205 | Poor 21.5% |
| Belgians | 16.1 /100 | #206 | Poor 21.5% |
| Ghanaians | 15.7 /100 | #207 | Poor 21.6% |
| Haitians | 15.4 /100 | #208 | Poor 21.6% |
| Immigrants | Eastern Africa | 15.1 /100 | #209 | Poor 21.6% |
| Immigrants | Panama | 14.4 /100 | #210 | Poor 21.6% |
| Icelanders | 14.0 /100 | #211 | Poor 21.6% |
| Jamaicans | 14.0 /100 | #212 | Poor 21.6% |
| Guamanians/Chamorros | 13.7 /100 | #213 | Poor 21.6% |
| Immigrants | Nicaragua | 13.3 /100 | #214 | Poor 21.6% |
| Ecuadorians | 12.3 /100 | #215 | Poor 21.6% |
| Immigrants | Barbados | 12.2 /100 | #216 | Poor 21.7% |
| Immigrants | St. Vincent and the Grenadines | 11.7 /100 | #217 | Poor 21.7% |
| Nepalese | 9.7 /100 | #218 | Tragic 21.7% |
| Panamanians | 9.4 /100 | #219 | Tragic 21.7% |
Demographics Similar to Immigrants from Laos by Single Female Poverty
In terms of single female poverty, the demographic groups most similar to Immigrants from Laos are Scotch-Irish (22.9%, a difference of 0.070%), Central American (23.0%, a difference of 0.17%), Immigrants from Micronesia (23.0%, a difference of 0.38%), Senegalese (23.0%, a difference of 0.44%), and British West Indian (22.8%, a difference of 0.48%).
| Demographics | Rating | Rank | Single Female Poverty |
| Sudanese | 0.7 /100 | #257 | Tragic 22.6% |
| Bahamians | 0.6 /100 | #258 | Tragic 22.7% |
| Whites/Caucasians | 0.6 /100 | #259 | Tragic 22.7% |
| Celtics | 0.5 /100 | #260 | Tragic 22.7% |
| Immigrants | Cabo Verde | 0.4 /100 | #261 | Tragic 22.8% |
| British West Indians | 0.4 /100 | #262 | Tragic 22.8% |
| Scotch-Irish | 0.3 /100 | #263 | Tragic 22.9% |
| Immigrants | Laos | 0.3 /100 | #264 | Tragic 22.9% |
| Central Americans | 0.2 /100 | #265 | Tragic 23.0% |
| Immigrants | Micronesia | 0.2 /100 | #266 | Tragic 23.0% |
| Senegalese | 0.2 /100 | #267 | Tragic 23.0% |
| Fijians | 0.2 /100 | #268 | Tragic 23.1% |
| Hmong | 0.2 /100 | #269 | Tragic 23.1% |
| Inupiat | 0.2 /100 | #270 | Tragic 23.1% |
| Sub-Saharan Africans | 0.1 /100 | #271 | Tragic 23.2% |