Immigrants from Grenada vs Indian (Asian) Single Female Poverty
COMPARE
Immigrants from Grenada
Indian (Asian)
Single Female Poverty
Single Female Poverty Comparison
Immigrants from Grenada
Indians (Asian)
21.8%
SINGLE FEMALE POVERTY
8.0/ 100
METRIC RATING
221st/ 347
METRIC RANK
17.9%
SINGLE FEMALE POVERTY
100.0/ 100
METRIC RATING
15th/ 347
METRIC RANK
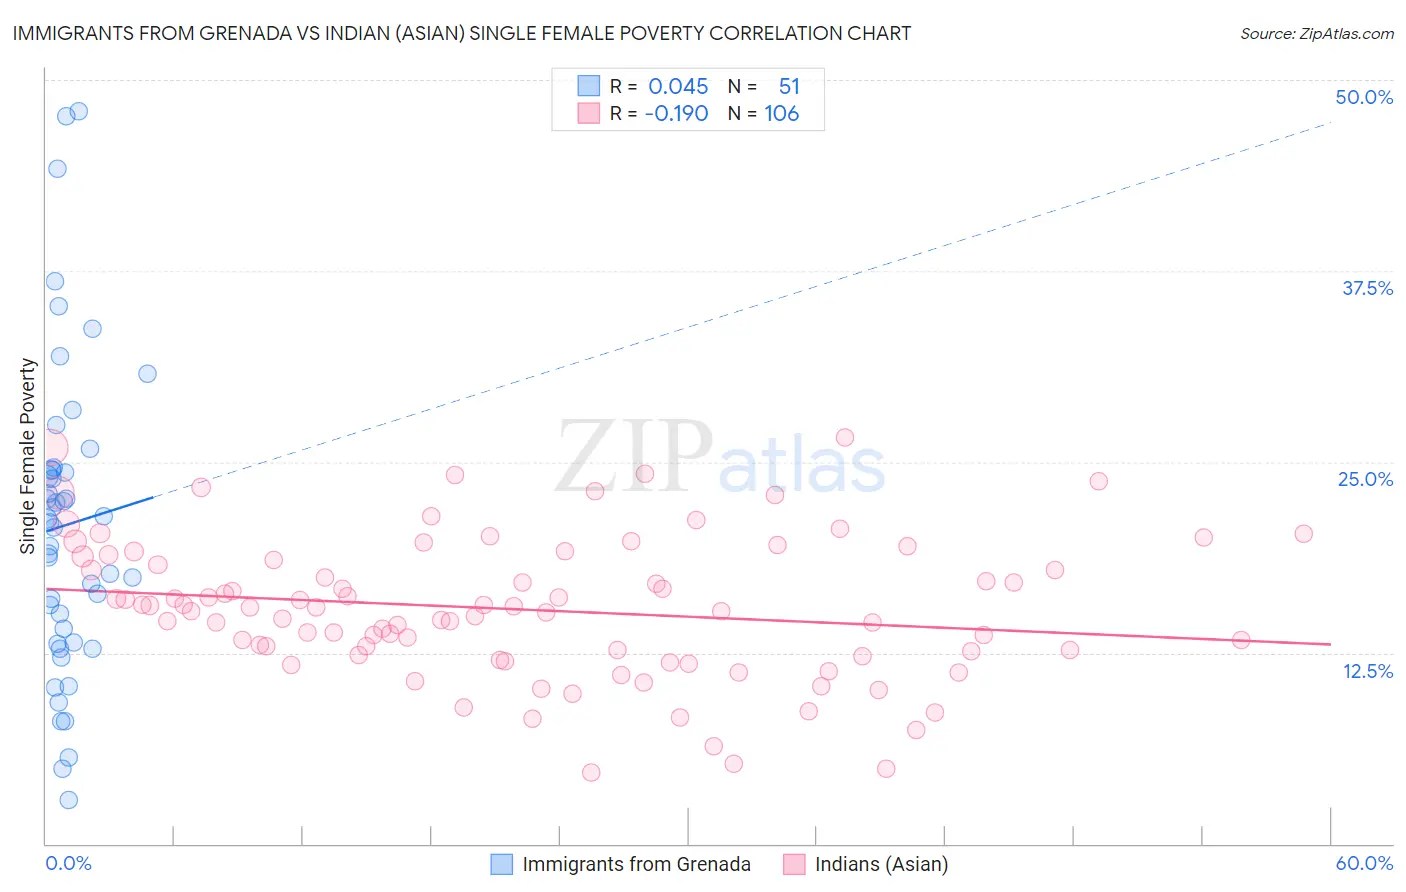
Immigrants from Grenada vs Indian (Asian) Single Female Poverty Correlation Chart
The statistical analysis conducted on geographies consisting of 66,935,343 people shows no correlation between the proportion of Immigrants from Grenada and poverty level among single females in the United States with a correlation coefficient (R) of 0.045 and weighted average of 21.8%. Similarly, the statistical analysis conducted on geographies consisting of 483,253,971 people shows a poor negative correlation between the proportion of Indians (Asian) and poverty level among single females in the United States with a correlation coefficient (R) of -0.190 and weighted average of 17.9%, a difference of 21.5%.
Single Female Poverty Correlation Summary
| Measurement | Immigrants from Grenada | Indian (Asian) |
| Minimum | 2.9% | 4.6% |
| Maximum | 47.9% | 26.6% |
| Range | 45.1% | 21.9% |
| Mean | 20.9% | 15.3% |
| Median | 21.0% | 15.4% |
| Interquartile 25% (IQ1) | 13.2% | 12.4% |
| Interquartile 75% (IQ3) | 24.4% | 18.6% |
| Interquartile Range (IQR) | 11.3% | 6.2% |
| Standard Deviation (Sample) | 10.1% | 4.6% |
| Standard Deviation (Population) | 10.0% | 4.6% |
Similar Demographics by Single Female Poverty
Demographics Similar to Immigrants from Grenada by Single Female Poverty
In terms of single female poverty, the demographic groups most similar to Immigrants from Grenada are Immigrants from Eritrea (21.8%, a difference of 0.010%), German (21.8%, a difference of 0.050%), Scottish (21.8%, a difference of 0.15%), Barbadian (21.8%, a difference of 0.17%), and Panamanian (21.7%, a difference of 0.26%).
| Demographics | Rating | Rank | Single Female Poverty |
| Immigrants | Nicaragua | 13.3 /100 | #214 | Poor 21.6% |
| Ecuadorians | 12.3 /100 | #215 | Poor 21.6% |
| Immigrants | Barbados | 12.2 /100 | #216 | Poor 21.7% |
| Immigrants | St. Vincent and the Grenadines | 11.7 /100 | #217 | Poor 21.7% |
| Nepalese | 9.7 /100 | #218 | Tragic 21.7% |
| Panamanians | 9.4 /100 | #219 | Tragic 21.7% |
| Germans | 8.3 /100 | #220 | Tragic 21.8% |
| Immigrants | Grenada | 8.0 /100 | #221 | Tragic 21.8% |
| Immigrants | Eritrea | 7.9 /100 | #222 | Tragic 21.8% |
| Scottish | 7.3 /100 | #223 | Tragic 21.8% |
| Barbadians | 7.2 /100 | #224 | Tragic 21.8% |
| English | 6.4 /100 | #225 | Tragic 21.9% |
| Immigrants | Portugal | 5.8 /100 | #226 | Tragic 21.9% |
| Immigrants | Ghana | 5.8 /100 | #227 | Tragic 21.9% |
| Salvadorans | 5.5 /100 | #228 | Tragic 21.9% |
Demographics Similar to Indians (Asian) by Single Female Poverty
In terms of single female poverty, the demographic groups most similar to Indians (Asian) are Bolivian (17.9%, a difference of 0.15%), Iranian (18.0%, a difference of 0.16%), Immigrants from Bolivia (17.8%, a difference of 0.59%), Immigrants from Korea (18.1%, a difference of 0.76%), and Immigrants from South Central Asia (17.8%, a difference of 0.85%).
| Demographics | Rating | Rank | Single Female Poverty |
| Immigrants | Iran | 100.0 /100 | #8 | Exceptional 17.5% |
| Bhutanese | 100.0 /100 | #9 | Exceptional 17.7% |
| Immigrants | Ireland | 100.0 /100 | #10 | Exceptional 17.8% |
| Immigrants | Lithuania | 100.0 /100 | #11 | Exceptional 17.8% |
| Immigrants | South Central Asia | 100.0 /100 | #12 | Exceptional 17.8% |
| Immigrants | Bolivia | 100.0 /100 | #13 | Exceptional 17.8% |
| Bolivians | 100.0 /100 | #14 | Exceptional 17.9% |
| Indians (Asian) | 100.0 /100 | #15 | Exceptional 17.9% |
| Iranians | 100.0 /100 | #16 | Exceptional 18.0% |
| Immigrants | Korea | 100.0 /100 | #17 | Exceptional 18.1% |
| Immigrants | Eastern Asia | 100.0 /100 | #18 | Exceptional 18.1% |
| Immigrants | China | 100.0 /100 | #19 | Exceptional 18.1% |
| Immigrants | Greece | 100.0 /100 | #20 | Exceptional 18.3% |
| Maltese | 100.0 /100 | #21 | Exceptional 18.3% |
| Burmese | 100.0 /100 | #22 | Exceptional 18.3% |