Immigrants from South America vs Guyanese Poverty
COMPARE
Immigrants from South America
Guyanese
Poverty
Poverty Comparison
Immigrants from South America
Guyanese
12.5%
POVERTY
32.3/ 100
METRIC RATING
190th/ 347
METRIC RANK
14.5%
POVERTY
0.1/ 100
METRIC RATING
266th/ 347
METRIC RANK
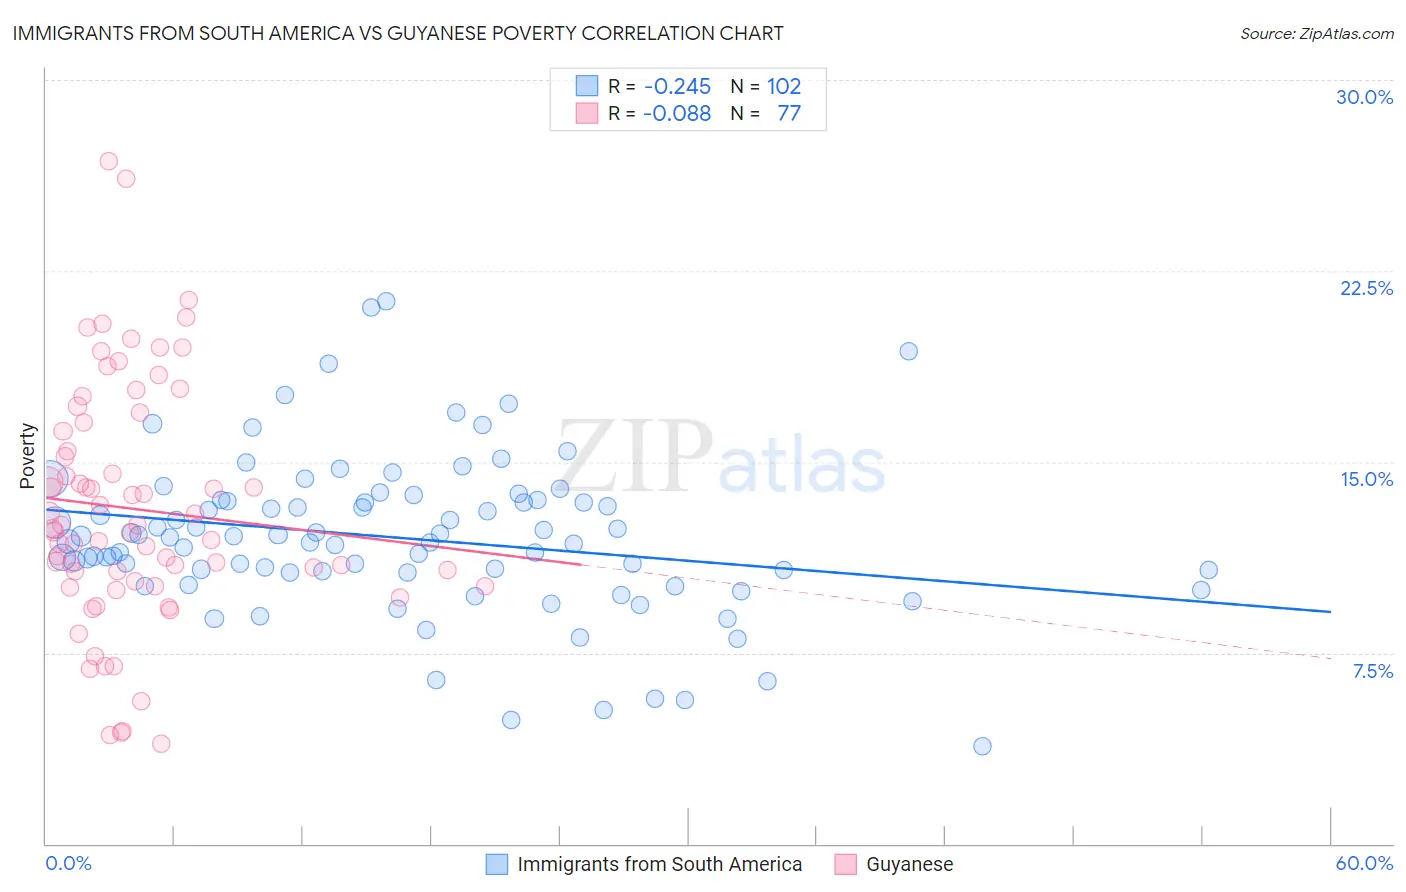
Immigrants from South America vs Guyanese Poverty Correlation Chart
The statistical analysis conducted on geographies consisting of 485,968,788 people shows a weak negative correlation between the proportion of Immigrants from South America and poverty level in the United States with a correlation coefficient (R) of -0.245 and weighted average of 12.5%. Similarly, the statistical analysis conducted on geographies consisting of 176,811,902 people shows a slight negative correlation between the proportion of Guyanese and poverty level in the United States with a correlation coefficient (R) of -0.088 and weighted average of 14.5%, a difference of 15.5%.
Poverty Correlation Summary
| Measurement | Immigrants from South America | Guyanese |
| Minimum | 3.8% | 3.9% |
| Maximum | 21.3% | 26.8% |
| Range | 17.5% | 22.9% |
| Mean | 12.0% | 13.1% |
| Median | 12.0% | 12.4% |
| Interquartile 25% (IQ1) | 10.7% | 10.2% |
| Interquartile 75% (IQ3) | 13.5% | 16.4% |
| Interquartile Range (IQR) | 2.8% | 6.2% |
| Standard Deviation (Sample) | 3.1% | 4.7% |
| Standard Deviation (Population) | 3.1% | 4.7% |
Similar Demographics by Poverty
Demographics Similar to Immigrants from South America by Poverty
In terms of poverty, the demographic groups most similar to Immigrants from South America are Aleut (12.5%, a difference of 0.090%), Immigrants from Costa Rica (12.5%, a difference of 0.10%), Sierra Leonean (12.6%, a difference of 0.10%), Hawaiian (12.5%, a difference of 0.19%), and Immigrants from Sierra Leone (12.5%, a difference of 0.41%).
| Demographics | Rating | Rank | Poverty |
| Immigrants | Iraq | 40.2 /100 | #183 | Average 12.4% |
| Kenyans | 38.8 /100 | #184 | Fair 12.5% |
| Israelis | 36.4 /100 | #185 | Fair 12.5% |
| Immigrants | Sierra Leone | 36.3 /100 | #186 | Fair 12.5% |
| Hawaiians | 34.1 /100 | #187 | Fair 12.5% |
| Immigrants | Costa Rica | 33.3 /100 | #188 | Fair 12.5% |
| Aleuts | 33.2 /100 | #189 | Fair 12.5% |
| Immigrants | South America | 32.3 /100 | #190 | Fair 12.5% |
| Sierra Leoneans | 31.5 /100 | #191 | Fair 12.6% |
| South American Indians | 23.3 /100 | #192 | Fair 12.7% |
| Delaware | 21.4 /100 | #193 | Fair 12.7% |
| Arabs | 21.1 /100 | #194 | Fair 12.7% |
| Immigrants | Kuwait | 20.9 /100 | #195 | Fair 12.7% |
| Iraqis | 20.8 /100 | #196 | Fair 12.7% |
| Immigrants | Lebanon | 18.7 /100 | #197 | Poor 12.8% |
Demographics Similar to Guyanese by Poverty
In terms of poverty, the demographic groups most similar to Guyanese are Immigrants from Guyana (14.5%, a difference of 0.17%), Immigrants from Jamaica (14.4%, a difference of 0.30%), Iroquois (14.5%, a difference of 0.32%), Subsaharan African (14.5%, a difference of 0.35%), and Jamaican (14.4%, a difference of 0.38%).
| Demographics | Rating | Rank | Poverty |
| Immigrants | Nicaragua | 0.1 /100 | #259 | Tragic 14.3% |
| Cape Verdeans | 0.1 /100 | #260 | Tragic 14.4% |
| Cherokee | 0.1 /100 | #261 | Tragic 14.4% |
| Immigrants | Liberia | 0.1 /100 | #262 | Tragic 14.4% |
| Jamaicans | 0.1 /100 | #263 | Tragic 14.4% |
| Immigrants | Jamaica | 0.1 /100 | #264 | Tragic 14.4% |
| Immigrants | Guyana | 0.1 /100 | #265 | Tragic 14.5% |
| Guyanese | 0.1 /100 | #266 | Tragic 14.5% |
| Iroquois | 0.1 /100 | #267 | Tragic 14.5% |
| Sub-Saharan Africans | 0.1 /100 | #268 | Tragic 14.5% |
| Immigrants | Cuba | 0.1 /100 | #269 | Tragic 14.6% |
| Central Americans | 0.1 /100 | #270 | Tragic 14.6% |
| Shoshone | 0.0 /100 | #271 | Tragic 14.7% |
| Chickasaw | 0.0 /100 | #272 | Tragic 14.7% |
| Spanish Americans | 0.0 /100 | #273 | Tragic 14.7% |