Spaniard vs Guyanese Poverty
COMPARE
Spaniard
Guyanese
Poverty
Poverty Comparison
Spaniards
Guyanese
12.8%
POVERTY
16.5/ 100
METRIC RATING
200th/ 347
METRIC RANK
14.5%
POVERTY
0.1/ 100
METRIC RATING
266th/ 347
METRIC RANK
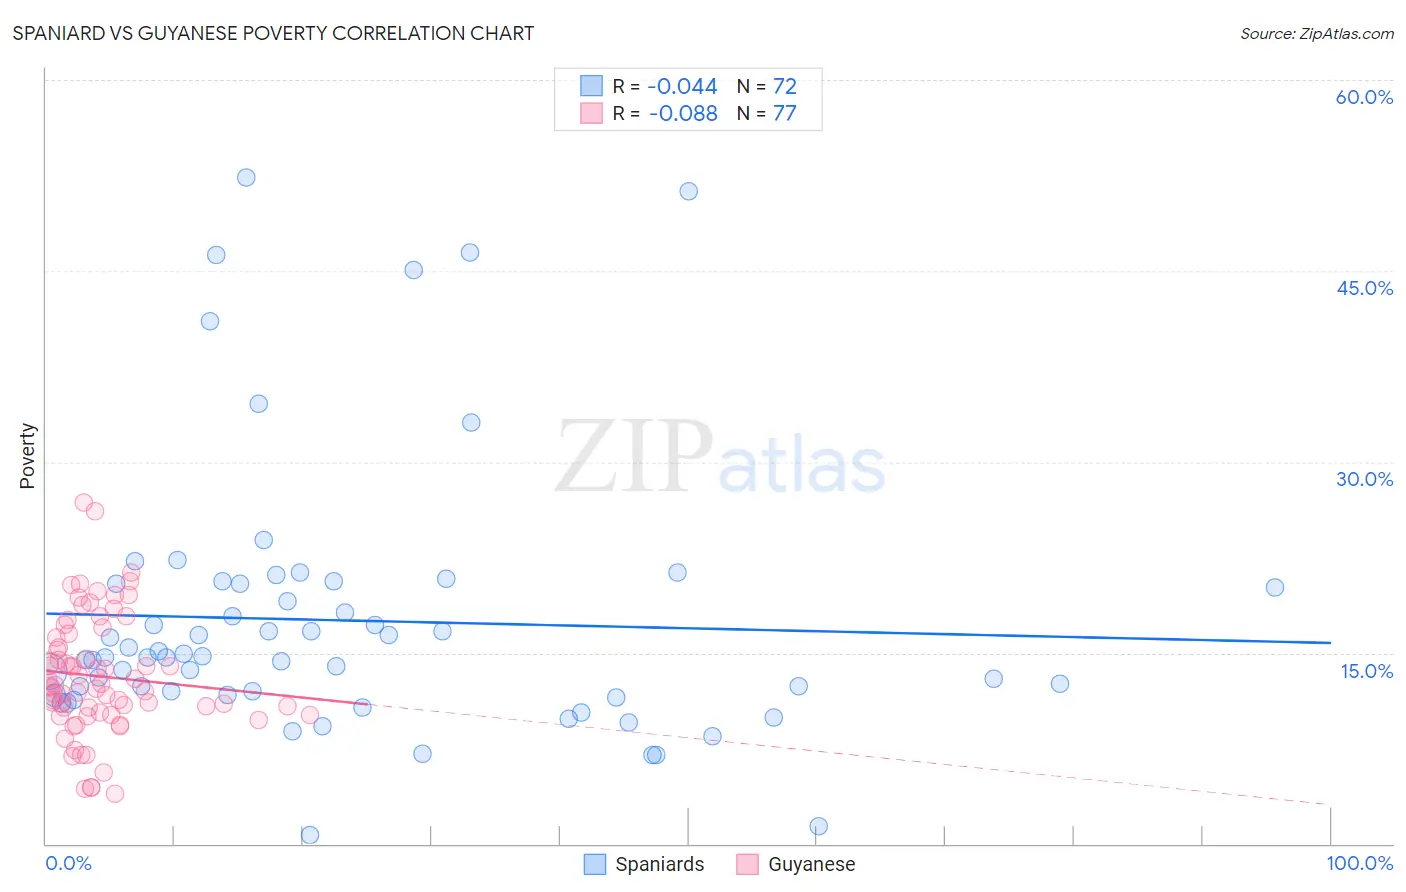
Spaniard vs Guyanese Poverty Correlation Chart
The statistical analysis conducted on geographies consisting of 443,194,534 people shows no correlation between the proportion of Spaniards and poverty level in the United States with a correlation coefficient (R) of -0.044 and weighted average of 12.8%. Similarly, the statistical analysis conducted on geographies consisting of 176,811,902 people shows a slight negative correlation between the proportion of Guyanese and poverty level in the United States with a correlation coefficient (R) of -0.088 and weighted average of 14.5%, a difference of 13.1%.
Poverty Correlation Summary
| Measurement | Spaniard | Guyanese |
| Minimum | 0.64% | 3.9% |
| Maximum | 52.4% | 26.8% |
| Range | 51.7% | 22.9% |
| Mean | 17.5% | 13.1% |
| Median | 14.7% | 12.4% |
| Interquartile 25% (IQ1) | 11.7% | 10.2% |
| Interquartile 75% (IQ3) | 20.5% | 16.4% |
| Interquartile Range (IQR) | 8.8% | 6.2% |
| Standard Deviation (Sample) | 10.6% | 4.7% |
| Standard Deviation (Population) | 10.5% | 4.7% |
Similar Demographics by Poverty
Demographics Similar to Spaniards by Poverty
In terms of poverty, the demographic groups most similar to Spaniards are Immigrants from Uganda (12.8%, a difference of 0.0%), Immigrants from Kenya (12.8%, a difference of 0.16%), Immigrants from Uruguay (12.8%, a difference of 0.16%), Hmong (12.8%, a difference of 0.27%), and Immigrants from Lebanon (12.8%, a difference of 0.35%).
| Demographics | Rating | Rank | Poverty |
| Delaware | 21.4 /100 | #193 | Fair 12.7% |
| Arabs | 21.1 /100 | #194 | Fair 12.7% |
| Immigrants | Kuwait | 20.9 /100 | #195 | Fair 12.7% |
| Iraqis | 20.8 /100 | #196 | Fair 12.7% |
| Immigrants | Lebanon | 18.7 /100 | #197 | Poor 12.8% |
| Spanish | 18.7 /100 | #198 | Poor 12.8% |
| Immigrants | Kenya | 17.5 /100 | #199 | Poor 12.8% |
| Spaniards | 16.5 /100 | #200 | Poor 12.8% |
| Immigrants | Uganda | 16.5 /100 | #201 | Poor 12.8% |
| Immigrants | Uruguay | 15.6 /100 | #202 | Poor 12.8% |
| Hmong | 15.0 /100 | #203 | Poor 12.8% |
| Immigrants | Western Asia | 14.1 /100 | #204 | Poor 12.9% |
| Tsimshian | 9.2 /100 | #205 | Tragic 13.0% |
| Immigrants | Eastern Africa | 7.0 /100 | #206 | Tragic 13.1% |
| Panamanians | 6.6 /100 | #207 | Tragic 13.1% |
Demographics Similar to Guyanese by Poverty
In terms of poverty, the demographic groups most similar to Guyanese are Immigrants from Guyana (14.5%, a difference of 0.17%), Immigrants from Jamaica (14.4%, a difference of 0.30%), Iroquois (14.5%, a difference of 0.32%), Subsaharan African (14.5%, a difference of 0.35%), and Jamaican (14.4%, a difference of 0.38%).
| Demographics | Rating | Rank | Poverty |
| Immigrants | Nicaragua | 0.1 /100 | #259 | Tragic 14.3% |
| Cape Verdeans | 0.1 /100 | #260 | Tragic 14.4% |
| Cherokee | 0.1 /100 | #261 | Tragic 14.4% |
| Immigrants | Liberia | 0.1 /100 | #262 | Tragic 14.4% |
| Jamaicans | 0.1 /100 | #263 | Tragic 14.4% |
| Immigrants | Jamaica | 0.1 /100 | #264 | Tragic 14.4% |
| Immigrants | Guyana | 0.1 /100 | #265 | Tragic 14.5% |
| Guyanese | 0.1 /100 | #266 | Tragic 14.5% |
| Iroquois | 0.1 /100 | #267 | Tragic 14.5% |
| Sub-Saharan Africans | 0.1 /100 | #268 | Tragic 14.5% |
| Immigrants | Cuba | 0.1 /100 | #269 | Tragic 14.6% |
| Central Americans | 0.1 /100 | #270 | Tragic 14.6% |
| Shoshone | 0.0 /100 | #271 | Tragic 14.7% |
| Chickasaw | 0.0 /100 | #272 | Tragic 14.7% |
| Spanish Americans | 0.0 /100 | #273 | Tragic 14.7% |