Iraqi vs Guyanese Poverty
COMPARE
Iraqi
Guyanese
Poverty
Poverty Comparison
Iraqis
Guyanese
12.7%
POVERTY
20.8/ 100
METRIC RATING
196th/ 347
METRIC RANK
14.5%
POVERTY
0.1/ 100
METRIC RATING
266th/ 347
METRIC RANK
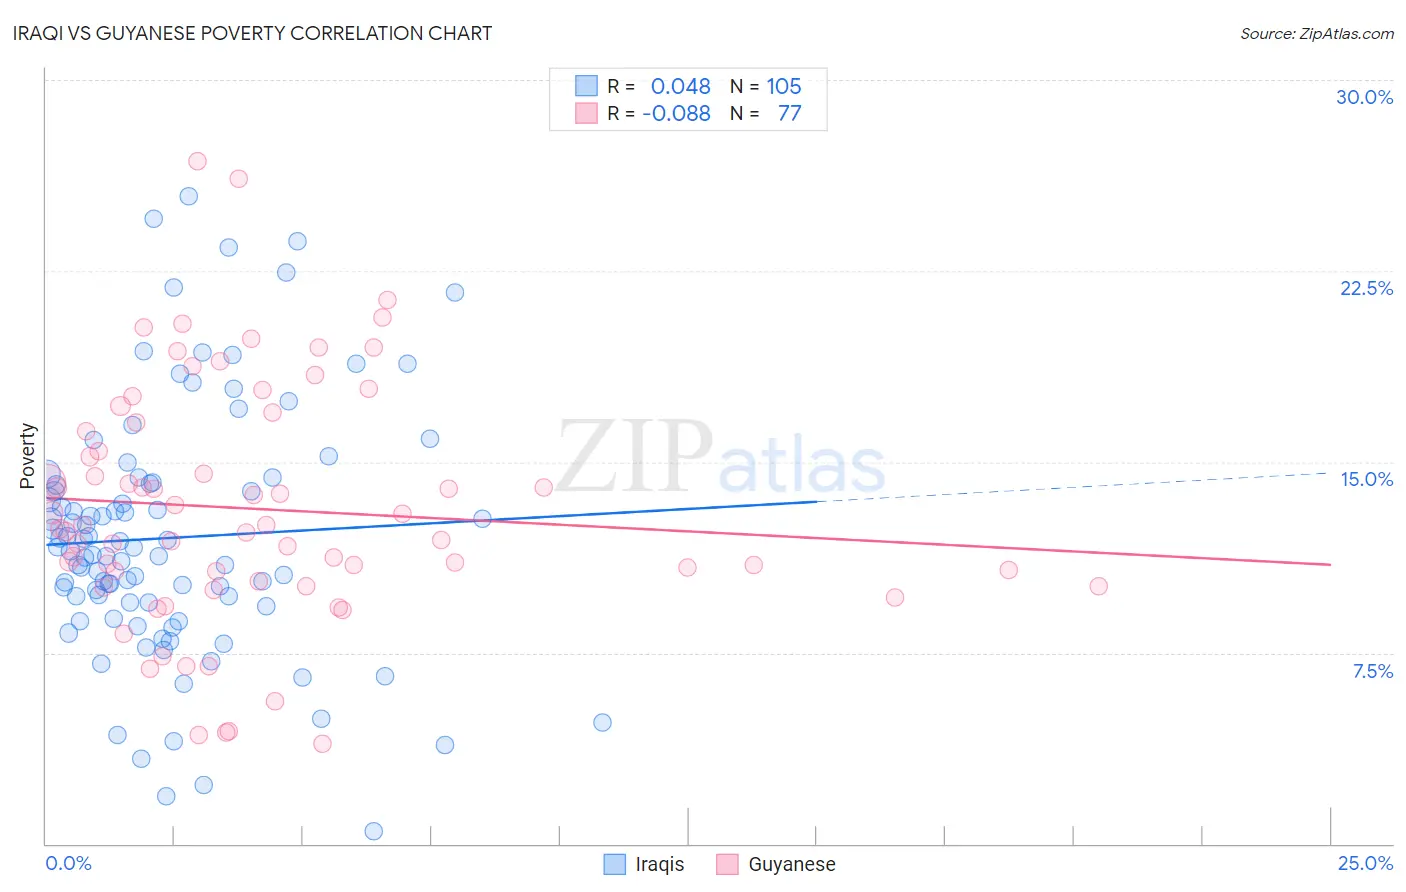
Iraqi vs Guyanese Poverty Correlation Chart
The statistical analysis conducted on geographies consisting of 170,596,700 people shows no correlation between the proportion of Iraqis and poverty level in the United States with a correlation coefficient (R) of 0.048 and weighted average of 12.7%. Similarly, the statistical analysis conducted on geographies consisting of 176,811,902 people shows a slight negative correlation between the proportion of Guyanese and poverty level in the United States with a correlation coefficient (R) of -0.088 and weighted average of 14.5%, a difference of 13.9%.
Poverty Correlation Summary
| Measurement | Iraqi | Guyanese |
| Minimum | 0.47% | 3.9% |
| Maximum | 25.4% | 26.8% |
| Range | 25.0% | 22.9% |
| Mean | 12.0% | 13.1% |
| Median | 11.5% | 12.4% |
| Interquartile 25% (IQ1) | 9.4% | 10.2% |
| Interquartile 75% (IQ3) | 14.2% | 16.4% |
| Interquartile Range (IQR) | 4.8% | 6.2% |
| Standard Deviation (Sample) | 4.9% | 4.7% |
| Standard Deviation (Population) | 4.9% | 4.7% |
Similar Demographics by Poverty
Demographics Similar to Iraqis by Poverty
In terms of poverty, the demographic groups most similar to Iraqis are Immigrants from Kuwait (12.7%, a difference of 0.020%), Arab (12.7%, a difference of 0.050%), Delaware (12.7%, a difference of 0.090%), Immigrants from Lebanon (12.8%, a difference of 0.31%), and Spanish (12.8%, a difference of 0.31%).
| Demographics | Rating | Rank | Poverty |
| Aleuts | 33.2 /100 | #189 | Fair 12.5% |
| Immigrants | South America | 32.3 /100 | #190 | Fair 12.5% |
| Sierra Leoneans | 31.5 /100 | #191 | Fair 12.6% |
| South American Indians | 23.3 /100 | #192 | Fair 12.7% |
| Delaware | 21.4 /100 | #193 | Fair 12.7% |
| Arabs | 21.1 /100 | #194 | Fair 12.7% |
| Immigrants | Kuwait | 20.9 /100 | #195 | Fair 12.7% |
| Iraqis | 20.8 /100 | #196 | Fair 12.7% |
| Immigrants | Lebanon | 18.7 /100 | #197 | Poor 12.8% |
| Spanish | 18.7 /100 | #198 | Poor 12.8% |
| Immigrants | Kenya | 17.5 /100 | #199 | Poor 12.8% |
| Spaniards | 16.5 /100 | #200 | Poor 12.8% |
| Immigrants | Uganda | 16.5 /100 | #201 | Poor 12.8% |
| Immigrants | Uruguay | 15.6 /100 | #202 | Poor 12.8% |
| Hmong | 15.0 /100 | #203 | Poor 12.8% |
Demographics Similar to Guyanese by Poverty
In terms of poverty, the demographic groups most similar to Guyanese are Immigrants from Guyana (14.5%, a difference of 0.17%), Immigrants from Jamaica (14.4%, a difference of 0.30%), Iroquois (14.5%, a difference of 0.32%), Subsaharan African (14.5%, a difference of 0.35%), and Jamaican (14.4%, a difference of 0.38%).
| Demographics | Rating | Rank | Poverty |
| Immigrants | Nicaragua | 0.1 /100 | #259 | Tragic 14.3% |
| Cape Verdeans | 0.1 /100 | #260 | Tragic 14.4% |
| Cherokee | 0.1 /100 | #261 | Tragic 14.4% |
| Immigrants | Liberia | 0.1 /100 | #262 | Tragic 14.4% |
| Jamaicans | 0.1 /100 | #263 | Tragic 14.4% |
| Immigrants | Jamaica | 0.1 /100 | #264 | Tragic 14.4% |
| Immigrants | Guyana | 0.1 /100 | #265 | Tragic 14.5% |
| Guyanese | 0.1 /100 | #266 | Tragic 14.5% |
| Iroquois | 0.1 /100 | #267 | Tragic 14.5% |
| Sub-Saharan Africans | 0.1 /100 | #268 | Tragic 14.5% |
| Immigrants | Cuba | 0.1 /100 | #269 | Tragic 14.6% |
| Central Americans | 0.1 /100 | #270 | Tragic 14.6% |
| Shoshone | 0.0 /100 | #271 | Tragic 14.7% |
| Chickasaw | 0.0 /100 | #272 | Tragic 14.7% |
| Spanish Americans | 0.0 /100 | #273 | Tragic 14.7% |