Jamaican vs Central American Indian Family Poverty
COMPARE
Jamaican
Central American Indian
Family Poverty
Family Poverty Comparison
Jamaicans
Central American Indians
11.1%
FAMILY POVERTY
0.1/ 100
METRIC RATING
268th/ 347
METRIC RANK
13.3%
FAMILY POVERTY
0.0/ 100
METRIC RATING
328th/ 347
METRIC RANK
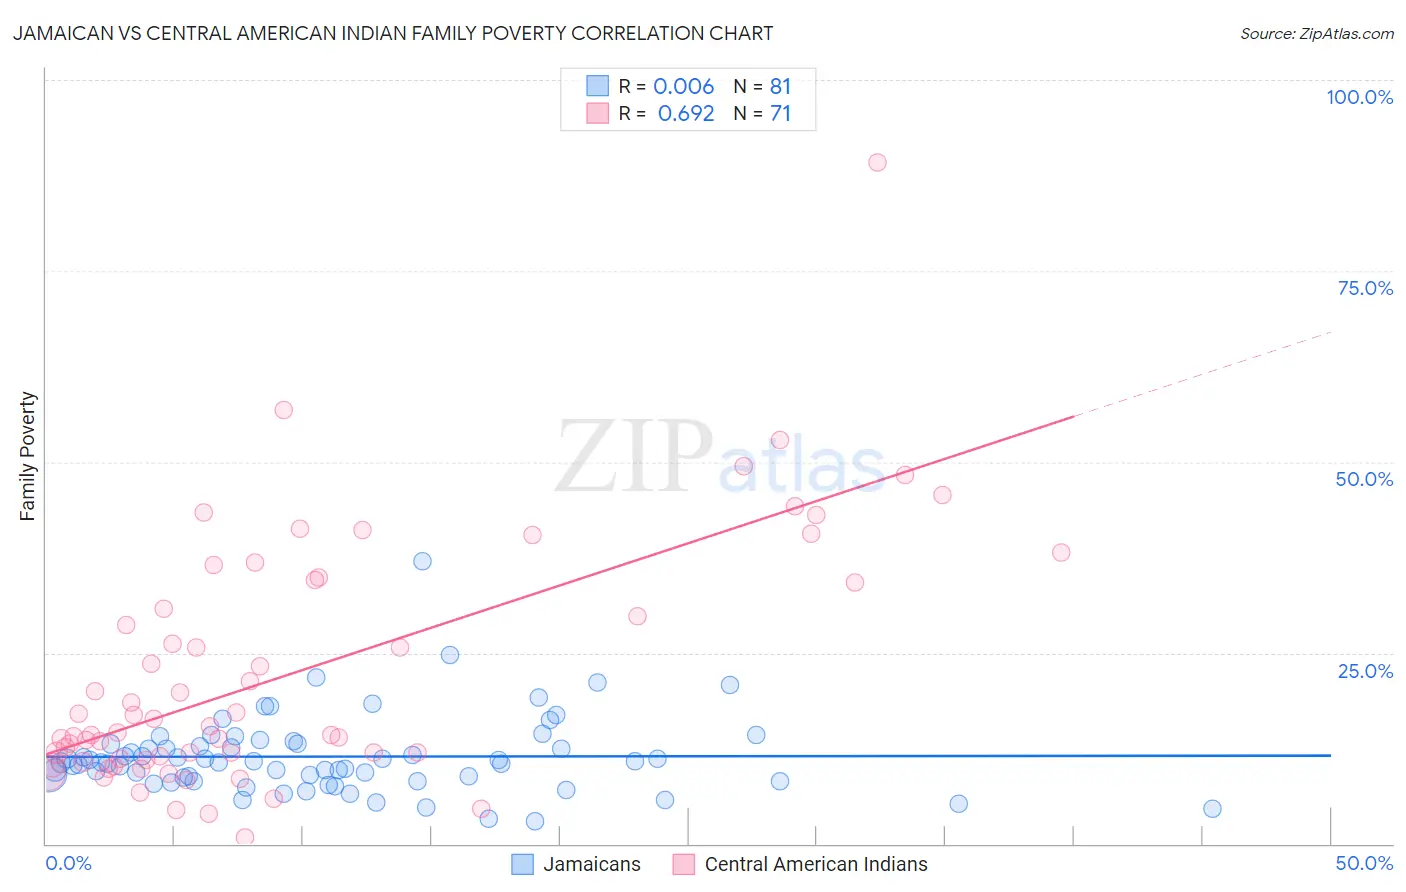
Jamaican vs Central American Indian Family Poverty Correlation Chart
The statistical analysis conducted on geographies consisting of 367,005,969 people shows no correlation between the proportion of Jamaicans and poverty level among families in the United States with a correlation coefficient (R) of 0.006 and weighted average of 11.1%. Similarly, the statistical analysis conducted on geographies consisting of 325,737,058 people shows a significant positive correlation between the proportion of Central American Indians and poverty level among families in the United States with a correlation coefficient (R) of 0.692 and weighted average of 13.3%, a difference of 20.3%.
Family Poverty Correlation Summary
| Measurement | Jamaican | Central American Indian |
| Minimum | 3.0% | 0.85% |
| Maximum | 37.0% | 89.1% |
| Range | 34.1% | 88.3% |
| Mean | 11.4% | 22.4% |
| Median | 10.6% | 15.5% |
| Interquartile 25% (IQ1) | 8.5% | 11.1% |
| Interquartile 75% (IQ3) | 13.1% | 34.5% |
| Interquartile Range (IQR) | 4.6% | 23.3% |
| Standard Deviation (Sample) | 5.1% | 16.1% |
| Standard Deviation (Population) | 5.1% | 16.0% |
Similar Demographics by Family Poverty
Demographics Similar to Jamaicans by Family Poverty
In terms of family poverty, the demographic groups most similar to Jamaicans are Comanche (11.0%, a difference of 0.10%), Immigrants from El Salvador (11.0%, a difference of 0.12%), Immigrants from Ecuador (11.1%, a difference of 0.48%), Immigrants from Nicaragua (11.1%, a difference of 0.49%), and Immigrants from Bahamas (11.1%, a difference of 0.73%).
| Demographics | Rating | Rank | Family Poverty |
| Shoshone | 0.2 /100 | #261 | Tragic 10.9% |
| Spanish American Indians | 0.2 /100 | #262 | Tragic 10.9% |
| Cape Verdeans | 0.1 /100 | #263 | Tragic 10.9% |
| Trinidadians and Tobagonians | 0.1 /100 | #264 | Tragic 10.9% |
| Immigrants | Trinidad and Tobago | 0.1 /100 | #265 | Tragic 10.9% |
| Immigrants | El Salvador | 0.1 /100 | #266 | Tragic 11.0% |
| Comanche | 0.1 /100 | #267 | Tragic 11.0% |
| Jamaicans | 0.1 /100 | #268 | Tragic 11.1% |
| Immigrants | Ecuador | 0.1 /100 | #269 | Tragic 11.1% |
| Immigrants | Nicaragua | 0.1 /100 | #270 | Tragic 11.1% |
| Immigrants | Bahamas | 0.1 /100 | #271 | Tragic 11.1% |
| Immigrants | Jamaica | 0.1 /100 | #272 | Tragic 11.2% |
| Somalis | 0.1 /100 | #273 | Tragic 11.2% |
| Spanish Americans | 0.1 /100 | #274 | Tragic 11.2% |
| Central Americans | 0.1 /100 | #275 | Tragic 11.2% |
Demographics Similar to Central American Indians by Family Poverty
In terms of family poverty, the demographic groups most similar to Central American Indians are Black/African American (13.3%, a difference of 0.17%), Yakama (13.1%, a difference of 1.7%), Colville (13.0%, a difference of 2.4%), Paiute (13.0%, a difference of 2.4%), and Immigrants from Dominica (12.7%, a difference of 4.4%).
| Demographics | Rating | Rank | Family Poverty |
| Arapaho | 0.0 /100 | #321 | Tragic 12.7% |
| Immigrants | Honduras | 0.0 /100 | #322 | Tragic 12.7% |
| Menominee | 0.0 /100 | #323 | Tragic 12.7% |
| Immigrants | Dominica | 0.0 /100 | #324 | Tragic 12.7% |
| Paiute | 0.0 /100 | #325 | Tragic 13.0% |
| Colville | 0.0 /100 | #326 | Tragic 13.0% |
| Yakama | 0.0 /100 | #327 | Tragic 13.1% |
| Central American Indians | 0.0 /100 | #328 | Tragic 13.3% |
| Blacks/African Americans | 0.0 /100 | #329 | Tragic 13.3% |
| Natives/Alaskans | 0.0 /100 | #330 | Tragic 14.3% |
| Cheyenne | 0.0 /100 | #331 | Tragic 14.3% |
| Dominicans | 0.0 /100 | #332 | Tragic 14.3% |
| Immigrants | Dominican Republic | 0.0 /100 | #333 | Tragic 14.4% |
| Houma | 0.0 /100 | #334 | Tragic 14.6% |
| Apache | 0.0 /100 | #335 | Tragic 14.7% |