Jamaican vs Cree Householder Income Over 65 years
COMPARE
Jamaican
Cree
Householder Income Over 65 years
Householder Income Over 65 years Comparison
Jamaicans
Cree
$54,560
HOUSEHOLDER INCOME OVER 65 YEARS
0.1/ 100
METRIC RATING
266th/ 347
METRIC RANK
$54,129
HOUSEHOLDER INCOME OVER 65 YEARS
0.1/ 100
METRIC RATING
276th/ 347
METRIC RANK
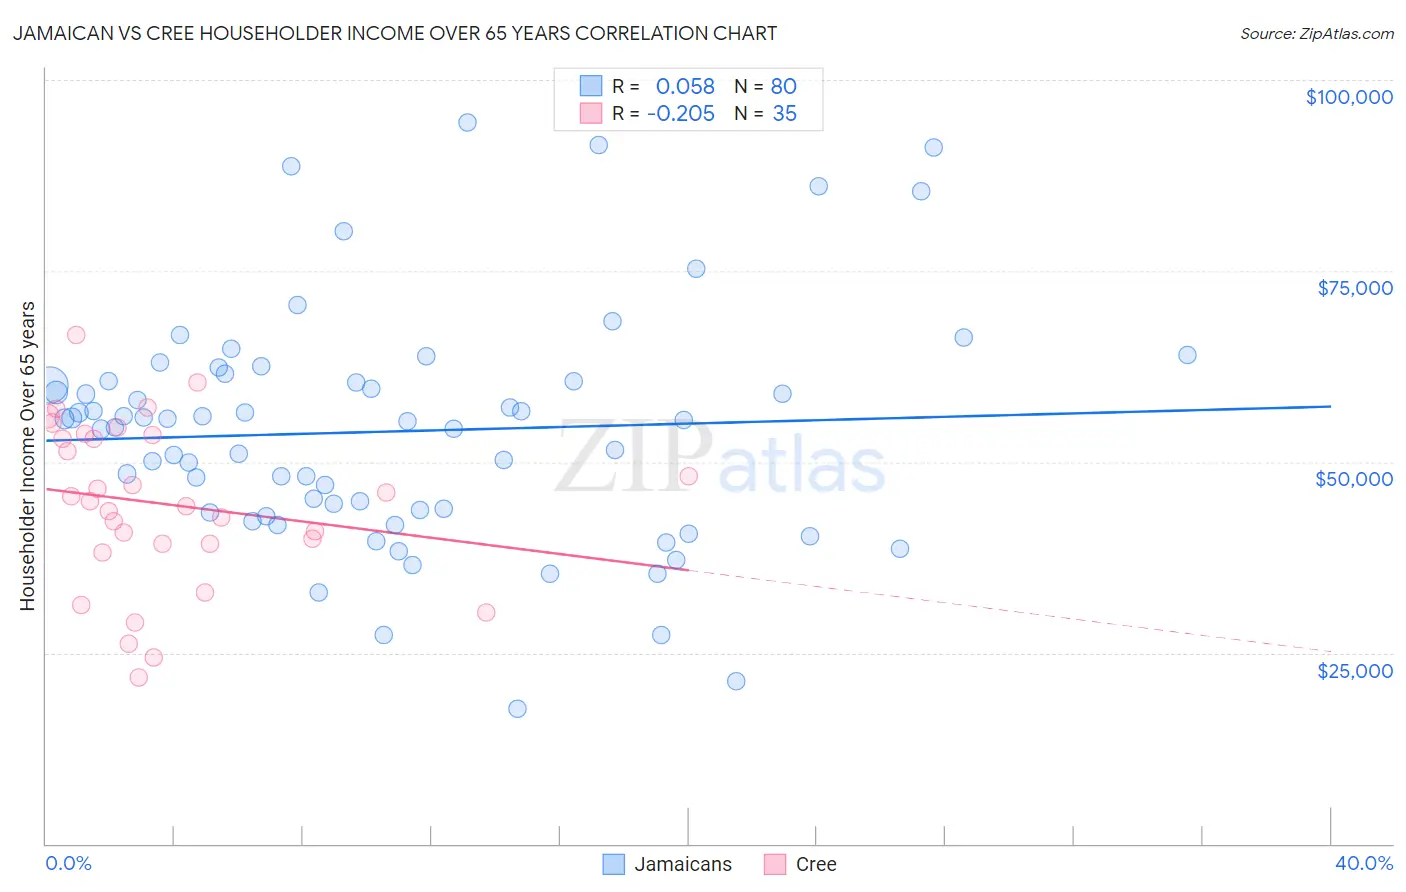
Jamaican vs Cree Householder Income Over 65 years Correlation Chart
The statistical analysis conducted on geographies consisting of 366,342,723 people shows a slight positive correlation between the proportion of Jamaicans and household income with householder over the age of 65 in the United States with a correlation coefficient (R) of 0.058 and weighted average of $54,560. Similarly, the statistical analysis conducted on geographies consisting of 76,146,635 people shows a weak negative correlation between the proportion of Cree and household income with householder over the age of 65 in the United States with a correlation coefficient (R) of -0.205 and weighted average of $54,129, a difference of 0.80%.
Householder Income Over 65 years Correlation Summary
| Measurement | Jamaican | Cree |
| Minimum | $17,596 | $21,771 |
| Maximum | $94,474 | $66,667 |
| Range | $76,878 | $44,896 |
| Mean | $53,994 | $44,467 |
| Median | $55,397 | $44,834 |
| Interquartile 25% (IQ1) | $43,595 | $39,228 |
| Interquartile 75% (IQ3) | $60,577 | $53,517 |
| Interquartile Range (IQR) | $16,982 | $14,289 |
| Standard Deviation (Sample) | $15,398 | $10,767 |
| Standard Deviation (Population) | $15,302 | $10,613 |
Demographics Similar to Jamaicans and Cree by Householder Income Over 65 years
In terms of householder income over 65 years, the demographic groups most similar to Jamaicans are Belizean ($54,580, a difference of 0.040%), Guatemalan ($54,526, a difference of 0.060%), Immigrants from Zaire ($54,512, a difference of 0.090%), Nicaraguan ($54,474, a difference of 0.16%), and Apache ($54,668, a difference of 0.20%). Similarly, the demographic groups most similar to Cree are Cherokee ($54,133, a difference of 0.010%), Barbadian ($54,163, a difference of 0.060%), Cheyenne ($54,096, a difference of 0.060%), Indonesian ($54,176, a difference of 0.090%), and Potawatomi ($54,212, a difference of 0.15%).
| Demographics | Rating | Rank | Householder Income Over 65 years |
| Comanche | 0.2 /100 | #261 | Tragic $54,922 |
| Bangladeshis | 0.1 /100 | #262 | Tragic $54,719 |
| French American Indians | 0.1 /100 | #263 | Tragic $54,699 |
| Apache | 0.1 /100 | #264 | Tragic $54,668 |
| Belizeans | 0.1 /100 | #265 | Tragic $54,580 |
| Jamaicans | 0.1 /100 | #266 | Tragic $54,560 |
| Guatemalans | 0.1 /100 | #267 | Tragic $54,526 |
| Immigrants | Zaire | 0.1 /100 | #268 | Tragic $54,512 |
| Nicaraguans | 0.1 /100 | #269 | Tragic $54,474 |
| Immigrants | Senegal | 0.1 /100 | #270 | Tragic $54,447 |
| Liberians | 0.1 /100 | #271 | Tragic $54,356 |
| Potawatomi | 0.1 /100 | #272 | Tragic $54,212 |
| Indonesians | 0.1 /100 | #273 | Tragic $54,176 |
| Barbadians | 0.1 /100 | #274 | Tragic $54,163 |
| Cherokee | 0.1 /100 | #275 | Tragic $54,133 |
| Cree | 0.1 /100 | #276 | Tragic $54,129 |
| Cheyenne | 0.1 /100 | #277 | Tragic $54,096 |
| Immigrants | Ecuador | 0.1 /100 | #278 | Tragic $54,030 |
| Blackfeet | 0.1 /100 | #279 | Tragic $54,029 |
| Immigrants | Jamaica | 0.1 /100 | #280 | Tragic $54,027 |
| Somalis | 0.1 /100 | #281 | Tragic $54,004 |