Jamaican vs Immigrants from Croatia Family Poverty
COMPARE
Jamaican
Immigrants from Croatia
Family Poverty
Family Poverty Comparison
Jamaicans
Immigrants from Croatia
11.1%
FAMILY POVERTY
0.1/ 100
METRIC RATING
268th/ 347
METRIC RANK
7.8%
FAMILY POVERTY
98.1/ 100
METRIC RATING
75th/ 347
METRIC RANK
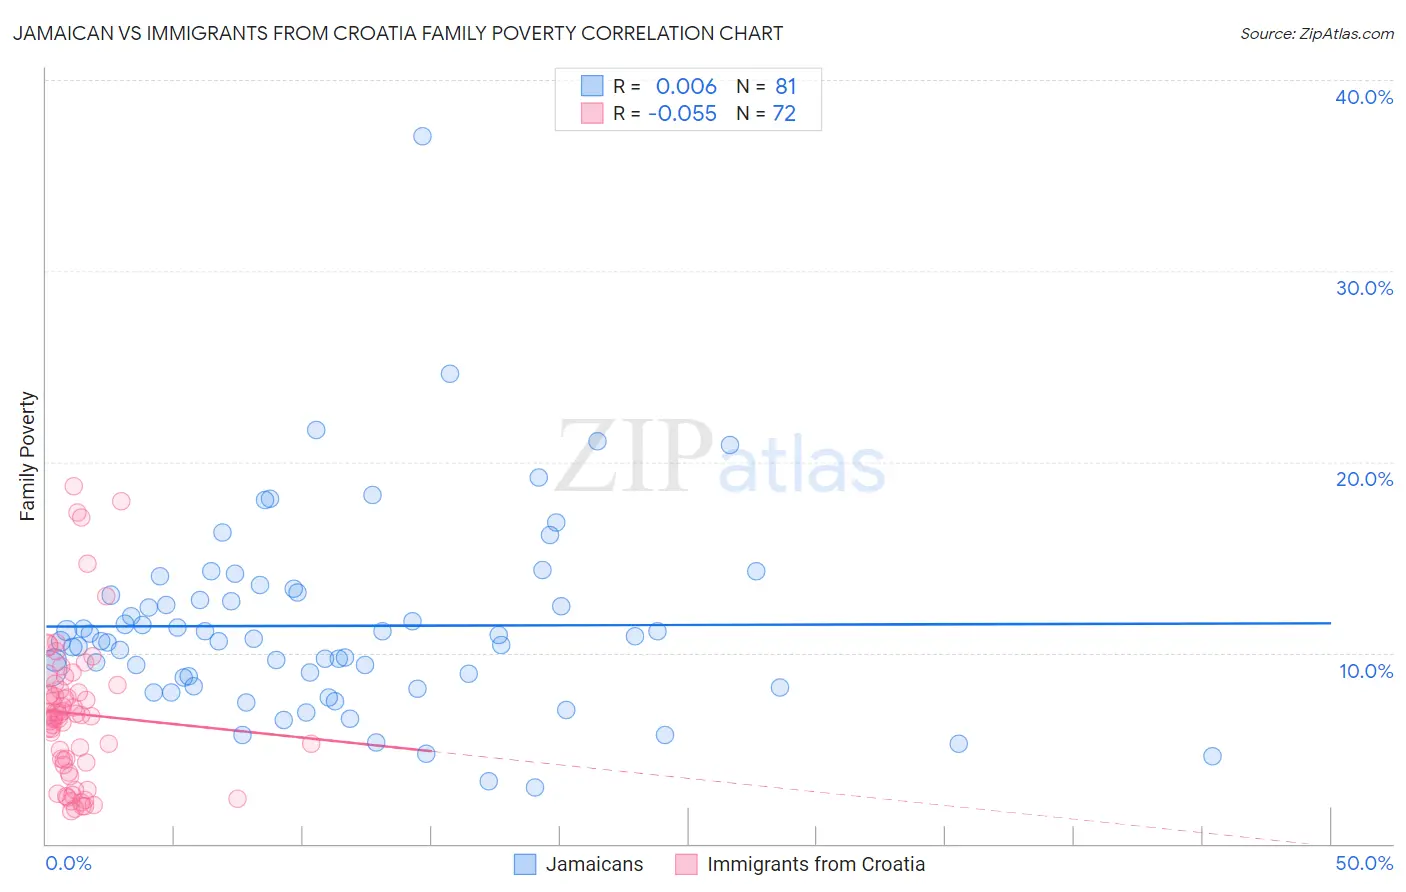
Jamaican vs Immigrants from Croatia Family Poverty Correlation Chart
The statistical analysis conducted on geographies consisting of 367,005,969 people shows no correlation between the proportion of Jamaicans and poverty level among families in the United States with a correlation coefficient (R) of 0.006 and weighted average of 11.1%. Similarly, the statistical analysis conducted on geographies consisting of 132,458,844 people shows a slight negative correlation between the proportion of Immigrants from Croatia and poverty level among families in the United States with a correlation coefficient (R) of -0.055 and weighted average of 7.8%, a difference of 40.9%.
Family Poverty Correlation Summary
| Measurement | Jamaican | Immigrants from Croatia |
| Minimum | 3.0% | 1.7% |
| Maximum | 37.0% | 18.7% |
| Range | 34.1% | 17.0% |
| Mean | 11.4% | 6.8% |
| Median | 10.6% | 6.7% |
| Interquartile 25% (IQ1) | 8.5% | 4.2% |
| Interquartile 75% (IQ3) | 13.1% | 8.2% |
| Interquartile Range (IQR) | 4.6% | 4.0% |
| Standard Deviation (Sample) | 5.1% | 3.9% |
| Standard Deviation (Population) | 5.1% | 3.8% |
Similar Demographics by Family Poverty
Demographics Similar to Jamaicans by Family Poverty
In terms of family poverty, the demographic groups most similar to Jamaicans are Comanche (11.0%, a difference of 0.10%), Immigrants from El Salvador (11.0%, a difference of 0.12%), Immigrants from Ecuador (11.1%, a difference of 0.48%), Immigrants from Nicaragua (11.1%, a difference of 0.49%), and Immigrants from Bahamas (11.1%, a difference of 0.73%).
| Demographics | Rating | Rank | Family Poverty |
| Shoshone | 0.2 /100 | #261 | Tragic 10.9% |
| Spanish American Indians | 0.2 /100 | #262 | Tragic 10.9% |
| Cape Verdeans | 0.1 /100 | #263 | Tragic 10.9% |
| Trinidadians and Tobagonians | 0.1 /100 | #264 | Tragic 10.9% |
| Immigrants | Trinidad and Tobago | 0.1 /100 | #265 | Tragic 10.9% |
| Immigrants | El Salvador | 0.1 /100 | #266 | Tragic 11.0% |
| Comanche | 0.1 /100 | #267 | Tragic 11.0% |
| Jamaicans | 0.1 /100 | #268 | Tragic 11.1% |
| Immigrants | Ecuador | 0.1 /100 | #269 | Tragic 11.1% |
| Immigrants | Nicaragua | 0.1 /100 | #270 | Tragic 11.1% |
| Immigrants | Bahamas | 0.1 /100 | #271 | Tragic 11.1% |
| Immigrants | Jamaica | 0.1 /100 | #272 | Tragic 11.2% |
| Somalis | 0.1 /100 | #273 | Tragic 11.2% |
| Spanish Americans | 0.1 /100 | #274 | Tragic 11.2% |
| Central Americans | 0.1 /100 | #275 | Tragic 11.2% |
Demographics Similar to Immigrants from Croatia by Family Poverty
In terms of family poverty, the demographic groups most similar to Immigrants from Croatia are Immigrants from China (7.8%, a difference of 0.14%), Immigrants from Romania (7.8%, a difference of 0.21%), Austrian (7.8%, a difference of 0.21%), Immigrants from Latvia (7.9%, a difference of 0.23%), and Ukrainian (7.9%, a difference of 0.24%).
| Demographics | Rating | Rank | Family Poverty |
| Australians | 98.2 /100 | #68 | Exceptional 7.8% |
| Immigrants | Belgium | 98.2 /100 | #69 | Exceptional 7.8% |
| Immigrants | Canada | 98.2 /100 | #70 | Exceptional 7.8% |
| Cambodians | 98.2 /100 | #71 | Exceptional 7.8% |
| Immigrants | Romania | 98.2 /100 | #72 | Exceptional 7.8% |
| Austrians | 98.2 /100 | #73 | Exceptional 7.8% |
| Immigrants | China | 98.1 /100 | #74 | Exceptional 7.8% |
| Immigrants | Croatia | 98.1 /100 | #75 | Exceptional 7.8% |
| Immigrants | Latvia | 98.0 /100 | #76 | Exceptional 7.9% |
| Ukrainians | 98.0 /100 | #77 | Exceptional 7.9% |
| Immigrants | North America | 97.9 /100 | #78 | Exceptional 7.9% |
| Immigrants | Europe | 97.8 /100 | #79 | Exceptional 7.9% |
| English | 97.8 /100 | #80 | Exceptional 7.9% |
| Irish | 97.8 /100 | #81 | Exceptional 7.9% |
| Immigrants | Poland | 97.8 /100 | #82 | Exceptional 7.9% |