Jamaican vs Asian Single Mother Households
COMPARE
Jamaican
Asian
Single Mother Households
Single Mother Households Comparison
Jamaicans
Asians
8.2%
SINGLE MOTHER HOUSEHOLDS
0.0/ 100
METRIC RATING
319th/ 347
METRIC RANK
5.6%
SINGLE MOTHER HOUSEHOLDS
98.5/ 100
METRIC RATING
69th/ 347
METRIC RANK
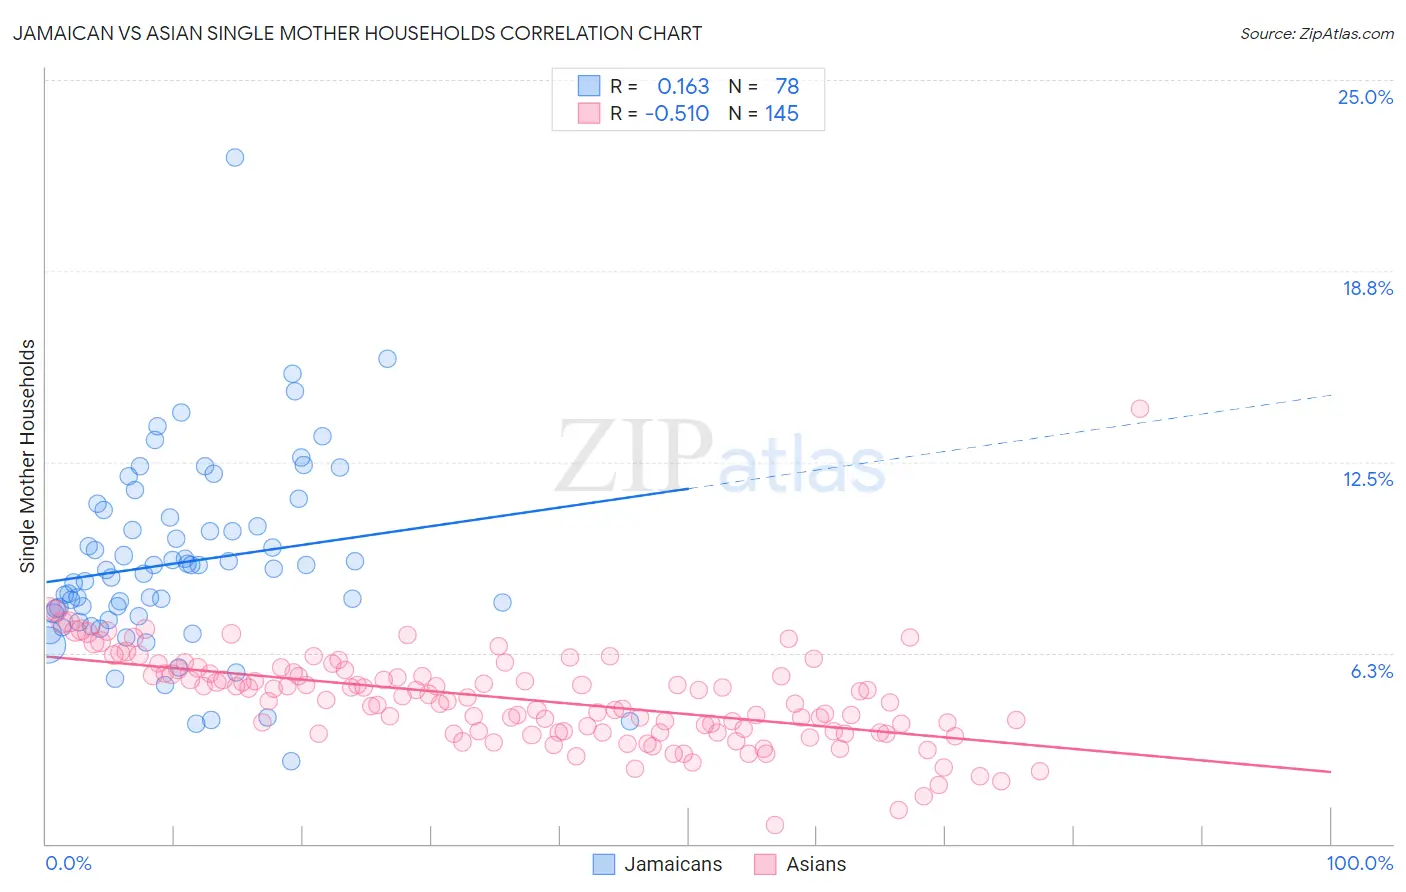
Jamaican vs Asian Single Mother Households Correlation Chart
The statistical analysis conducted on geographies consisting of 367,100,383 people shows a poor positive correlation between the proportion of Jamaicans and percentage of single mother households in the United States with a correlation coefficient (R) of 0.163 and weighted average of 8.2%. Similarly, the statistical analysis conducted on geographies consisting of 547,100,295 people shows a substantial negative correlation between the proportion of Asians and percentage of single mother households in the United States with a correlation coefficient (R) of -0.510 and weighted average of 5.6%, a difference of 47.4%.
Single Mother Households Correlation Summary
| Measurement | Jamaican | Asian |
| Minimum | 2.7% | 0.61% |
| Maximum | 22.5% | 14.2% |
| Range | 19.8% | 13.6% |
| Mean | 9.2% | 4.7% |
| Median | 9.0% | 4.7% |
| Interquartile 25% (IQ1) | 7.4% | 3.7% |
| Interquartile 75% (IQ3) | 10.7% | 5.6% |
| Interquartile Range (IQR) | 3.2% | 1.9% |
| Standard Deviation (Sample) | 3.1% | 1.6% |
| Standard Deviation (Population) | 3.1% | 1.6% |
Similar Demographics by Single Mother Households
Demographics Similar to Jamaicans by Single Mother Households
In terms of single mother households, the demographic groups most similar to Jamaicans are Senegalese (8.2%, a difference of 0.11%), Bahamian (8.3%, a difference of 0.12%), Immigrants from Senegal (8.3%, a difference of 0.36%), Pima (8.3%, a difference of 0.44%), and Immigrants from Honduras (8.2%, a difference of 0.68%).
| Demographics | Rating | Rank | Single Mother Households |
| Bangladeshis | 0.0 /100 | #312 | Tragic 8.1% |
| Immigrants | Grenada | 0.0 /100 | #313 | Tragic 8.2% |
| Immigrants | Mexico | 0.0 /100 | #314 | Tragic 8.2% |
| Immigrants | Western Africa | 0.0 /100 | #315 | Tragic 8.2% |
| Africans | 0.0 /100 | #316 | Tragic 8.2% |
| Immigrants | Honduras | 0.0 /100 | #317 | Tragic 8.2% |
| Senegalese | 0.0 /100 | #318 | Tragic 8.2% |
| Jamaicans | 0.0 /100 | #319 | Tragic 8.2% |
| Bahamians | 0.0 /100 | #320 | Tragic 8.3% |
| Immigrants | Senegal | 0.0 /100 | #321 | Tragic 8.3% |
| Pima | 0.0 /100 | #322 | Tragic 8.3% |
| Haitians | 0.0 /100 | #323 | Tragic 8.3% |
| Immigrants | Jamaica | 0.0 /100 | #324 | Tragic 8.4% |
| Immigrants | Caribbean | 0.0 /100 | #325 | Tragic 8.4% |
| British West Indians | 0.0 /100 | #326 | Tragic 8.4% |
Demographics Similar to Asians by Single Mother Households
In terms of single mother households, the demographic groups most similar to Asians are Immigrants from Bulgaria (5.6%, a difference of 0.020%), Immigrants from Eastern Europe (5.6%, a difference of 0.080%), Immigrants from Kazakhstan (5.6%, a difference of 0.080%), Italian (5.6%, a difference of 0.090%), and Immigrants from Canada (5.6%, a difference of 0.11%).
| Demographics | Rating | Rank | Single Mother Households |
| Poles | 98.6 /100 | #62 | Exceptional 5.6% |
| Immigrants | North Macedonia | 98.6 /100 | #63 | Exceptional 5.6% |
| Immigrants | France | 98.6 /100 | #64 | Exceptional 5.6% |
| Greeks | 98.6 /100 | #65 | Exceptional 5.6% |
| Immigrants | Canada | 98.5 /100 | #66 | Exceptional 5.6% |
| Italians | 98.5 /100 | #67 | Exceptional 5.6% |
| Immigrants | Bulgaria | 98.5 /100 | #68 | Exceptional 5.6% |
| Asians | 98.5 /100 | #69 | Exceptional 5.6% |
| Immigrants | Eastern Europe | 98.4 /100 | #70 | Exceptional 5.6% |
| Immigrants | Kazakhstan | 98.4 /100 | #71 | Exceptional 5.6% |
| Immigrants | Netherlands | 98.4 /100 | #72 | Exceptional 5.6% |
| Immigrants | Asia | 98.4 /100 | #73 | Exceptional 5.6% |
| Immigrants | North America | 98.3 /100 | #74 | Exceptional 5.6% |
| Slovenes | 98.3 /100 | #75 | Exceptional 5.6% |
| New Zealanders | 98.2 /100 | #76 | Exceptional 5.6% |