Crow vs Asian Single Father Poverty
COMPARE
Crow
Asian
Single Father Poverty
Single Father Poverty Comparison
Crow
Asians
30.3%
SINGLE FATHER POVERTY
0.0/ 100
METRIC RATING
345th/ 347
METRIC RANK
14.6%
SINGLE FATHER POVERTY
100.0/ 100
METRIC RATING
32nd/ 347
METRIC RANK
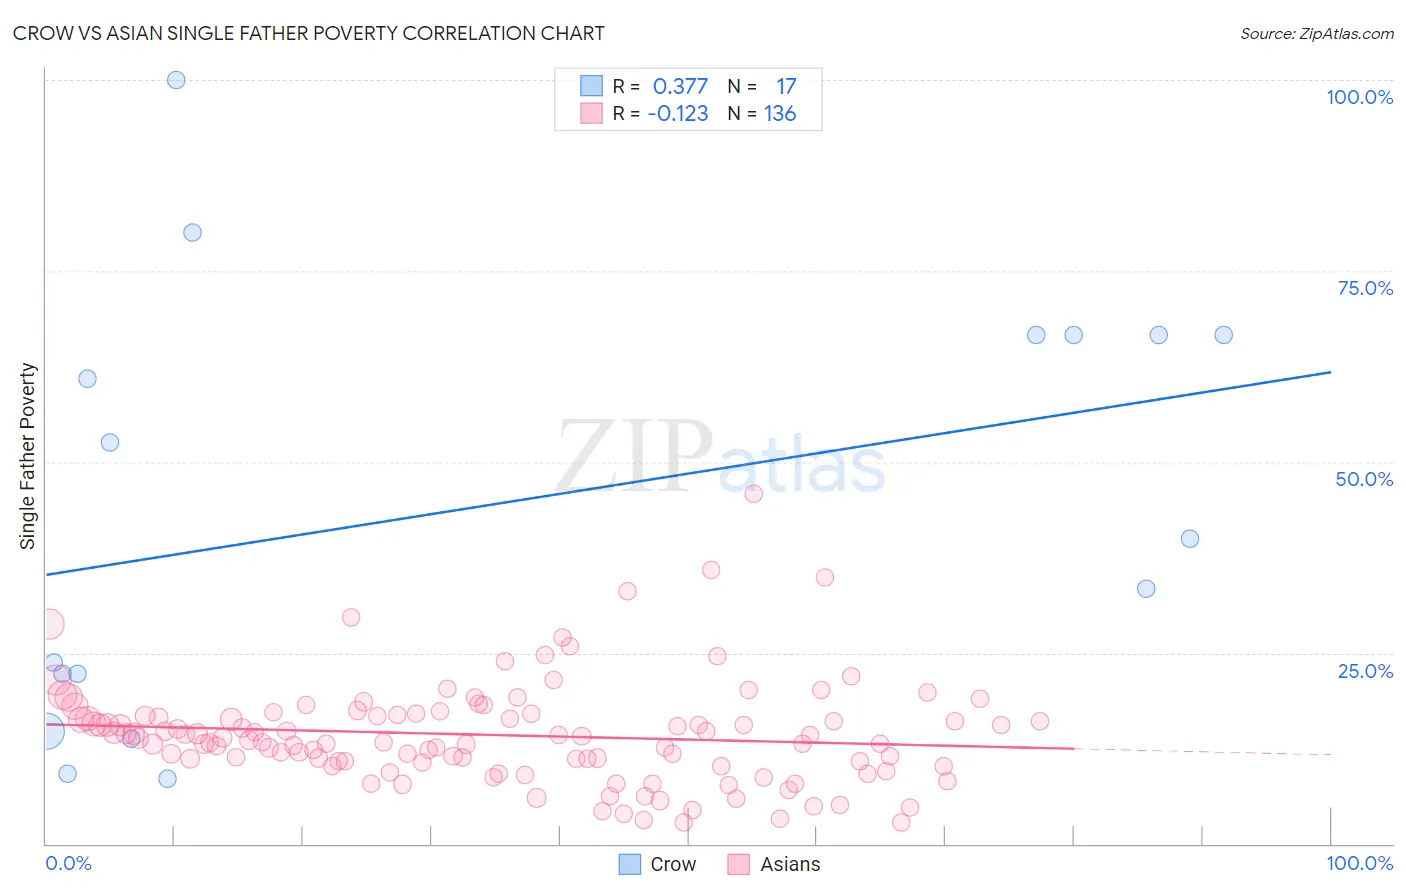
Crow vs Asian Single Father Poverty Correlation Chart
The statistical analysis conducted on geographies consisting of 55,517,191 people shows a mild positive correlation between the proportion of Crow and poverty level among single fathers in the United States with a correlation coefficient (R) of 0.377 and weighted average of 30.3%. Similarly, the statistical analysis conducted on geographies consisting of 402,614,567 people shows a poor negative correlation between the proportion of Asians and poverty level among single fathers in the United States with a correlation coefficient (R) of -0.123 and weighted average of 14.6%, a difference of 108.0%.
Single Father Poverty Correlation Summary
| Measurement | Crow | Asian |
| Minimum | 8.6% | 2.7% |
| Maximum | 100.0% | 45.8% |
| Range | 91.4% | 43.1% |
| Mean | 44.0% | 14.3% |
| Median | 40.0% | 13.7% |
| Interquartile 25% (IQ1) | 18.4% | 10.7% |
| Interquartile 75% (IQ3) | 66.7% | 16.8% |
| Interquartile Range (IQR) | 48.2% | 6.1% |
| Standard Deviation (Sample) | 28.0% | 6.7% |
| Standard Deviation (Population) | 27.2% | 6.7% |
Similar Demographics by Single Father Poverty
Demographics Similar to Crow by Single Father Poverty
In terms of single father poverty, the demographic groups most similar to Crow are Navajo (29.2%, a difference of 3.6%), Puerto Rican (31.5%, a difference of 4.1%), Lumbee (28.5%, a difference of 6.3%), Yuman (28.4%, a difference of 6.7%), and Yup'ik (32.5%, a difference of 7.4%).
| Demographics | Rating | Rank | Single Father Poverty |
| Natives/Alaskans | 0.0 /100 | #333 | Tragic 22.4% |
| Kiowa | 0.0 /100 | #334 | Tragic 22.5% |
| Shoshone | 0.0 /100 | #335 | Tragic 22.9% |
| Cajuns | 0.0 /100 | #336 | Tragic 23.1% |
| Sioux | 0.0 /100 | #337 | Tragic 23.9% |
| Arapaho | 0.0 /100 | #338 | Tragic 24.0% |
| Apache | 0.0 /100 | #339 | Tragic 24.2% |
| Houma | 0.0 /100 | #340 | Tragic 26.7% |
| Hopi | 0.0 /100 | #341 | Tragic 27.2% |
| Yuman | 0.0 /100 | #342 | Tragic 28.4% |
| Lumbee | 0.0 /100 | #343 | Tragic 28.5% |
| Navajo | 0.0 /100 | #344 | Tragic 29.2% |
| Crow | 0.0 /100 | #345 | Tragic 30.3% |
| Puerto Ricans | 0.0 /100 | #346 | Tragic 31.5% |
| Yup'ik | 0.0 /100 | #347 | Tragic 32.5% |
Demographics Similar to Asians by Single Father Poverty
In terms of single father poverty, the demographic groups most similar to Asians are Icelander (14.5%, a difference of 0.15%), Thai (14.5%, a difference of 0.24%), Somali (14.5%, a difference of 0.28%), Immigrants from South Central Asia (14.5%, a difference of 0.38%), and Okinawan (14.6%, a difference of 0.56%).
| Demographics | Rating | Rank | Single Father Poverty |
| Iranians | 100.0 /100 | #25 | Exceptional 14.4% |
| Spanish American Indians | 100.0 /100 | #26 | Exceptional 14.4% |
| Nepalese | 100.0 /100 | #27 | Exceptional 14.4% |
| Immigrants | South Central Asia | 100.0 /100 | #28 | Exceptional 14.5% |
| Somalis | 100.0 /100 | #29 | Exceptional 14.5% |
| Thais | 100.0 /100 | #30 | Exceptional 14.5% |
| Icelanders | 100.0 /100 | #31 | Exceptional 14.5% |
| Asians | 100.0 /100 | #32 | Exceptional 14.6% |
| Okinawans | 100.0 /100 | #33 | Exceptional 14.6% |
| Egyptians | 100.0 /100 | #34 | Exceptional 14.7% |
| Immigrants | Bolivia | 100.0 /100 | #35 | Exceptional 14.7% |
| Immigrants | Indonesia | 100.0 /100 | #36 | Exceptional 14.7% |
| Immigrants | Eastern Africa | 100.0 /100 | #37 | Exceptional 14.7% |
| Bolivians | 100.0 /100 | #38 | Exceptional 14.7% |
| Immigrants | Asia | 100.0 /100 | #39 | Exceptional 14.7% |