Guatemalan vs Asian Single Father Poverty
COMPARE
Guatemalan
Asian
Single Father Poverty
Single Father Poverty Comparison
Guatemalans
Asians
16.6%
SINGLE FATHER POVERTY
12.9/ 100
METRIC RATING
210th/ 347
METRIC RANK
14.6%
SINGLE FATHER POVERTY
100.0/ 100
METRIC RATING
32nd/ 347
METRIC RANK
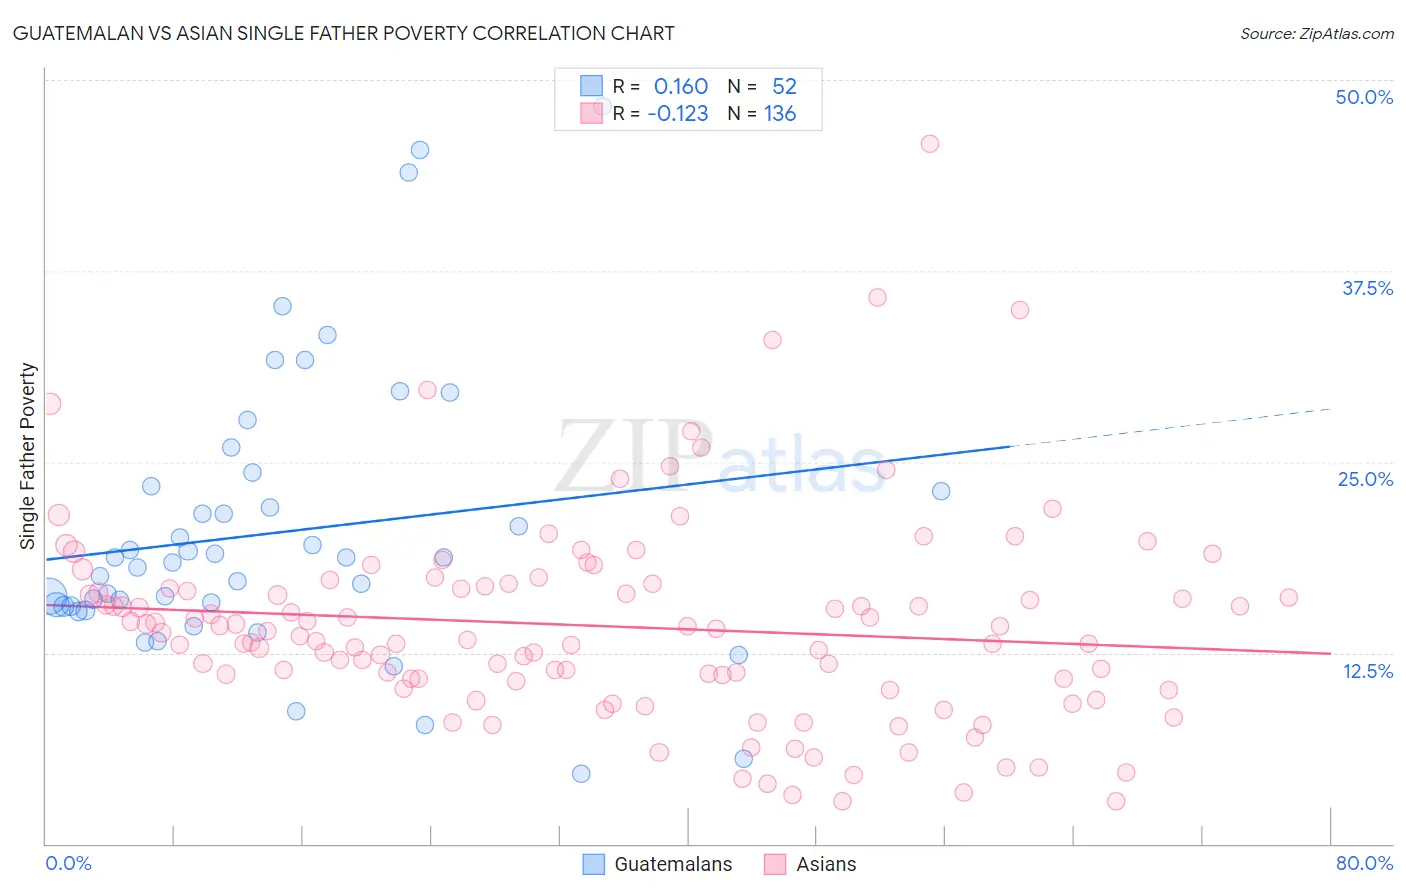
Guatemalan vs Asian Single Father Poverty Correlation Chart
The statistical analysis conducted on geographies consisting of 326,782,810 people shows a poor positive correlation between the proportion of Guatemalans and poverty level among single fathers in the United States with a correlation coefficient (R) of 0.160 and weighted average of 16.6%. Similarly, the statistical analysis conducted on geographies consisting of 402,614,567 people shows a poor negative correlation between the proportion of Asians and poverty level among single fathers in the United States with a correlation coefficient (R) of -0.123 and weighted average of 14.6%, a difference of 14.3%.
Single Father Poverty Correlation Summary
| Measurement | Guatemalan | Asian |
| Minimum | 4.6% | 2.7% |
| Maximum | 48.3% | 45.8% |
| Range | 43.7% | 43.1% |
| Mean | 20.4% | 14.3% |
| Median | 18.6% | 13.7% |
| Interquartile 25% (IQ1) | 15.5% | 10.7% |
| Interquartile 75% (IQ3) | 23.2% | 16.8% |
| Interquartile Range (IQR) | 7.7% | 6.1% |
| Standard Deviation (Sample) | 9.1% | 6.7% |
| Standard Deviation (Population) | 9.1% | 6.7% |
Similar Demographics by Single Father Poverty
Demographics Similar to Guatemalans by Single Father Poverty
In terms of single father poverty, the demographic groups most similar to Guatemalans are Arab (16.6%, a difference of 0.0%), European (16.6%, a difference of 0.030%), New Zealander (16.6%, a difference of 0.070%), Eastern European (16.6%, a difference of 0.070%), and Immigrants from Senegal (16.6%, a difference of 0.080%).
| Demographics | Rating | Rank | Single Father Poverty |
| Immigrants | North America | 15.1 /100 | #203 | Poor 16.6% |
| Immigrants | Guatemala | 14.8 /100 | #204 | Poor 16.6% |
| Venezuelans | 14.3 /100 | #205 | Poor 16.6% |
| Immigrants | Senegal | 13.7 /100 | #206 | Poor 16.6% |
| New Zealanders | 13.7 /100 | #207 | Poor 16.6% |
| Eastern Europeans | 13.7 /100 | #208 | Poor 16.6% |
| Europeans | 13.2 /100 | #209 | Poor 16.6% |
| Guatemalans | 12.9 /100 | #210 | Poor 16.6% |
| Arabs | 12.8 /100 | #211 | Poor 16.6% |
| Immigrants | Southern Europe | 11.2 /100 | #212 | Poor 16.7% |
| Ghanaians | 11.0 /100 | #213 | Poor 16.7% |
| Spanish | 10.7 /100 | #214 | Poor 16.7% |
| Immigrants | Scotland | 9.6 /100 | #215 | Tragic 16.7% |
| Immigrants | England | 9.5 /100 | #216 | Tragic 16.7% |
| Cheyenne | 9.3 /100 | #217 | Tragic 16.7% |
Demographics Similar to Asians by Single Father Poverty
In terms of single father poverty, the demographic groups most similar to Asians are Icelander (14.5%, a difference of 0.15%), Thai (14.5%, a difference of 0.24%), Somali (14.5%, a difference of 0.28%), Immigrants from South Central Asia (14.5%, a difference of 0.38%), and Okinawan (14.6%, a difference of 0.56%).
| Demographics | Rating | Rank | Single Father Poverty |
| Iranians | 100.0 /100 | #25 | Exceptional 14.4% |
| Spanish American Indians | 100.0 /100 | #26 | Exceptional 14.4% |
| Nepalese | 100.0 /100 | #27 | Exceptional 14.4% |
| Immigrants | South Central Asia | 100.0 /100 | #28 | Exceptional 14.5% |
| Somalis | 100.0 /100 | #29 | Exceptional 14.5% |
| Thais | 100.0 /100 | #30 | Exceptional 14.5% |
| Icelanders | 100.0 /100 | #31 | Exceptional 14.5% |
| Asians | 100.0 /100 | #32 | Exceptional 14.6% |
| Okinawans | 100.0 /100 | #33 | Exceptional 14.6% |
| Egyptians | 100.0 /100 | #34 | Exceptional 14.7% |
| Immigrants | Bolivia | 100.0 /100 | #35 | Exceptional 14.7% |
| Immigrants | Indonesia | 100.0 /100 | #36 | Exceptional 14.7% |
| Immigrants | Eastern Africa | 100.0 /100 | #37 | Exceptional 14.7% |
| Bolivians | 100.0 /100 | #38 | Exceptional 14.7% |
| Immigrants | Asia | 100.0 /100 | #39 | Exceptional 14.7% |