Jamaican vs Asian Receiving Food Stamps
COMPARE
Jamaican
Asian
Receiving Food Stamps
Receiving Food Stamps Comparison
Jamaicans
Asians
16.4%
RECEIVING FOOD STAMPS
0.0/ 100
METRIC RATING
306th/ 347
METRIC RANK
9.7%
RECEIVING FOOD STAMPS
99.3/ 100
METRIC RATING
51st/ 347
METRIC RANK
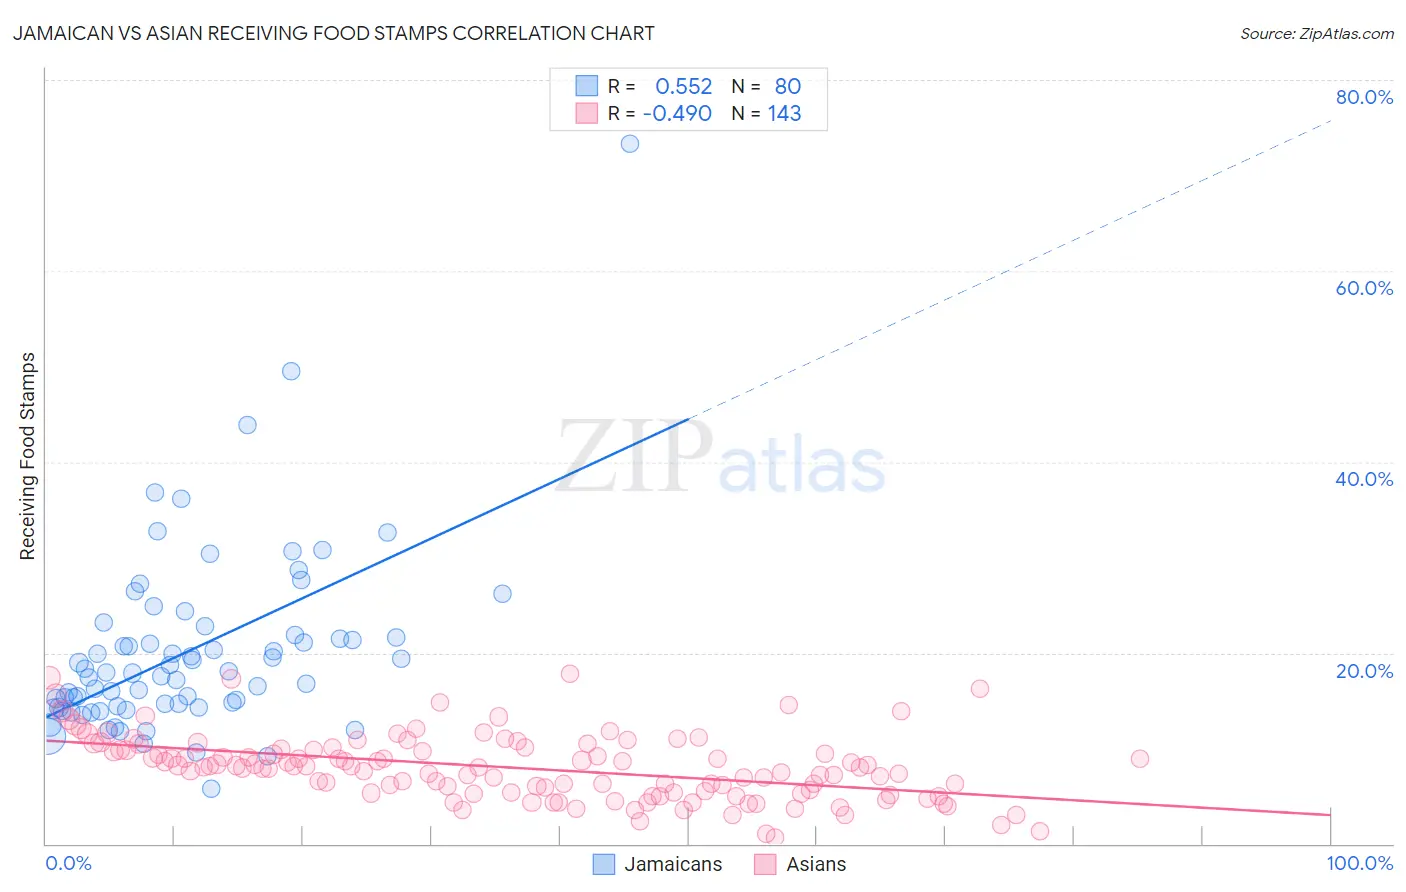
Jamaican vs Asian Receiving Food Stamps Correlation Chart
The statistical analysis conducted on geographies consisting of 367,071,648 people shows a substantial positive correlation between the proportion of Jamaicans and percentage of population receiving government assistance and/or food stamps in the United States with a correlation coefficient (R) of 0.552 and weighted average of 16.4%. Similarly, the statistical analysis conducted on geographies consisting of 547,774,062 people shows a moderate negative correlation between the proportion of Asians and percentage of population receiving government assistance and/or food stamps in the United States with a correlation coefficient (R) of -0.490 and weighted average of 9.7%, a difference of 69.4%.
Receiving Food Stamps Correlation Summary
| Measurement | Jamaican | Asian |
| Minimum | 5.8% | 0.60% |
| Maximum | 73.3% | 17.9% |
| Range | 67.5% | 17.3% |
| Mean | 20.1% | 8.0% |
| Median | 17.9% | 8.0% |
| Interquartile 25% (IQ1) | 14.4% | 5.3% |
| Interquartile 75% (IQ3) | 21.7% | 9.9% |
| Interquartile Range (IQR) | 7.3% | 4.6% |
| Standard Deviation (Sample) | 9.8% | 3.4% |
| Standard Deviation (Population) | 9.7% | 3.4% |
Similar Demographics by Receiving Food Stamps
Demographics Similar to Jamaicans by Receiving Food Stamps
In terms of receiving food stamps, the demographic groups most similar to Jamaicans are Immigrants from the Azores (16.4%, a difference of 0.070%), Houma (16.5%, a difference of 0.29%), Barbadian (16.5%, a difference of 0.55%), U.S. Virgin Islander (16.5%, a difference of 0.79%), and West Indian (16.3%, a difference of 0.94%).
| Demographics | Rating | Rank | Receiving Food Stamps |
| Hispanics or Latinos | 0.0 /100 | #299 | Tragic 15.8% |
| Immigrants | Bangladesh | 0.0 /100 | #300 | Tragic 15.9% |
| Trinidadians and Tobagonians | 0.0 /100 | #301 | Tragic 16.0% |
| Immigrants | West Indies | 0.0 /100 | #302 | Tragic 16.1% |
| Nicaraguans | 0.0 /100 | #303 | Tragic 16.1% |
| West Indians | 0.0 /100 | #304 | Tragic 16.3% |
| Immigrants | Azores | 0.0 /100 | #305 | Tragic 16.4% |
| Jamaicans | 0.0 /100 | #306 | Tragic 16.4% |
| Houma | 0.0 /100 | #307 | Tragic 16.5% |
| Barbadians | 0.0 /100 | #308 | Tragic 16.5% |
| U.S. Virgin Islanders | 0.0 /100 | #309 | Tragic 16.5% |
| Immigrants | Barbados | 0.0 /100 | #310 | Tragic 16.6% |
| Guyanese | 0.0 /100 | #311 | Tragic 16.7% |
| Sioux | 0.0 /100 | #312 | Tragic 16.8% |
| Immigrants | Jamaica | 0.0 /100 | #313 | Tragic 16.9% |
Demographics Similar to Asians by Receiving Food Stamps
In terms of receiving food stamps, the demographic groups most similar to Asians are Immigrants from South Africa (9.7%, a difference of 0.010%), Tongan (9.7%, a difference of 0.030%), Swiss (9.7%, a difference of 0.15%), Immigrants from Switzerland (9.7%, a difference of 0.16%), and Lithuanian (9.7%, a difference of 0.18%).
| Demographics | Rating | Rank | Receiving Food Stamps |
| Immigrants | Denmark | 99.4 /100 | #44 | Exceptional 9.6% |
| Immigrants | Belgium | 99.4 /100 | #45 | Exceptional 9.6% |
| Australians | 99.4 /100 | #46 | Exceptional 9.6% |
| Indians (Asian) | 99.4 /100 | #47 | Exceptional 9.6% |
| Russians | 99.4 /100 | #48 | Exceptional 9.6% |
| Immigrants | Czechoslovakia | 99.4 /100 | #49 | Exceptional 9.6% |
| Lithuanians | 99.4 /100 | #50 | Exceptional 9.7% |
| Asians | 99.3 /100 | #51 | Exceptional 9.7% |
| Immigrants | South Africa | 99.3 /100 | #52 | Exceptional 9.7% |
| Tongans | 99.3 /100 | #53 | Exceptional 9.7% |
| Swiss | 99.3 /100 | #54 | Exceptional 9.7% |
| Immigrants | Switzerland | 99.3 /100 | #55 | Exceptional 9.7% |
| Immigrants | Canada | 99.3 /100 | #56 | Exceptional 9.7% |
| Greeks | 99.3 /100 | #57 | Exceptional 9.7% |
| Scandinavians | 99.2 /100 | #58 | Exceptional 9.7% |