Italian vs Immigrants from Japan Single Male Poverty
COMPARE
Italian
Immigrants from Japan
Single Male Poverty
Single Male Poverty Comparison
Italians
Immigrants from Japan
13.1%
SINGLE MALE POVERTY
15.9/ 100
METRIC RATING
213th/ 347
METRIC RANK
11.3%
SINGLE MALE POVERTY
100.0/ 100
METRIC RATING
26th/ 347
METRIC RANK
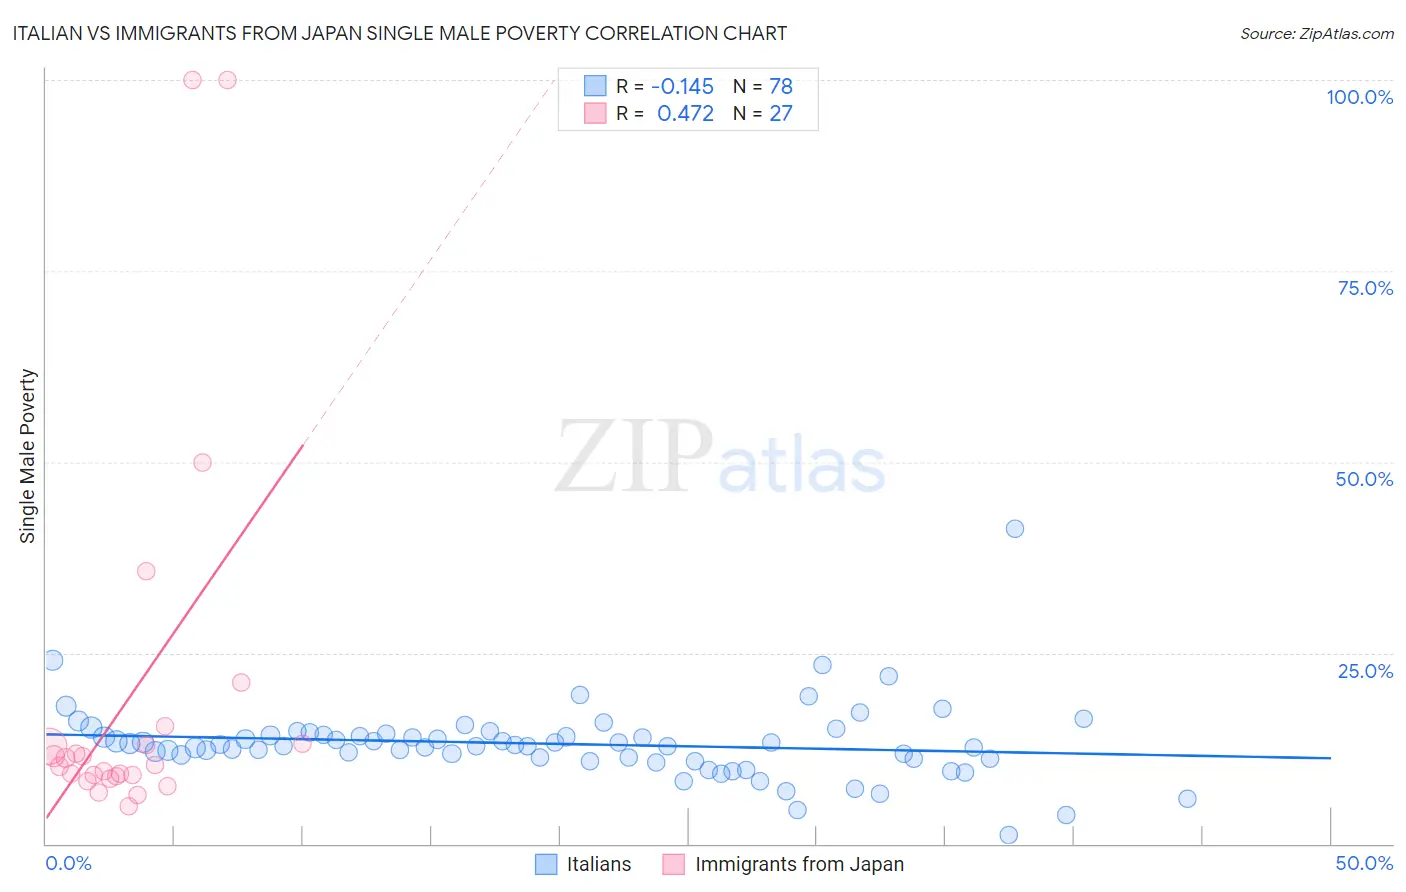
Italian vs Immigrants from Japan Single Male Poverty Correlation Chart
The statistical analysis conducted on geographies consisting of 474,306,770 people shows a poor negative correlation between the proportion of Italians and poverty level among single males in the United States with a correlation coefficient (R) of -0.145 and weighted average of 13.1%. Similarly, the statistical analysis conducted on geographies consisting of 305,055,385 people shows a moderate positive correlation between the proportion of Immigrants from Japan and poverty level among single males in the United States with a correlation coefficient (R) of 0.472 and weighted average of 11.3%, a difference of 15.8%.
Single Male Poverty Correlation Summary
| Measurement | Italian | Immigrants from Japan |
| Minimum | 1.1% | 4.9% |
| Maximum | 41.2% | 100.0% |
| Range | 40.1% | 95.1% |
| Mean | 13.1% | 19.4% |
| Median | 12.9% | 10.3% |
| Interquartile 25% (IQ1) | 11.2% | 8.8% |
| Interquartile 75% (IQ3) | 14.3% | 13.1% |
| Interquartile Range (IQR) | 3.1% | 4.3% |
| Standard Deviation (Sample) | 5.0% | 25.1% |
| Standard Deviation (Population) | 5.0% | 24.6% |
Similar Demographics by Single Male Poverty
Demographics Similar to Italians by Single Male Poverty
In terms of single male poverty, the demographic groups most similar to Italians are Senegalese (13.1%, a difference of 0.050%), Swedish (13.1%, a difference of 0.080%), Immigrants from Haiti (13.1%, a difference of 0.090%), Zimbabwean (13.1%, a difference of 0.090%), and Japanese (13.1%, a difference of 0.11%).
| Demographics | Rating | Rank | Single Male Poverty |
| Northern Europeans | 18.9 /100 | #206 | Poor 13.0% |
| Sudanese | 17.7 /100 | #207 | Poor 13.1% |
| Immigrants | Western Africa | 17.6 /100 | #208 | Poor 13.1% |
| Mexican American Indians | 17.5 /100 | #209 | Poor 13.1% |
| Immigrants | Haiti | 16.8 /100 | #210 | Poor 13.1% |
| Swedes | 16.8 /100 | #211 | Poor 13.1% |
| Senegalese | 16.4 /100 | #212 | Poor 13.1% |
| Italians | 15.9 /100 | #213 | Poor 13.1% |
| Zimbabweans | 14.9 /100 | #214 | Poor 13.1% |
| Japanese | 14.8 /100 | #215 | Poor 13.1% |
| Austrians | 13.9 /100 | #216 | Poor 13.1% |
| Bermudans | 13.0 /100 | #217 | Poor 13.1% |
| Scandinavians | 12.9 /100 | #218 | Poor 13.1% |
| Immigrants | Burma/Myanmar | 12.6 /100 | #219 | Poor 13.1% |
| Central Americans | 10.9 /100 | #220 | Poor 13.2% |
Demographics Similar to Immigrants from Japan by Single Male Poverty
In terms of single male poverty, the demographic groups most similar to Immigrants from Japan are Maltese (11.3%, a difference of 0.33%), Indian (Asian) (11.3%, a difference of 0.35%), Bolivian (11.2%, a difference of 0.55%), Immigrants from China (11.4%, a difference of 0.71%), and Immigrants from Pakistan (11.2%, a difference of 0.76%).
| Demographics | Rating | Rank | Single Male Poverty |
| Immigrants | Moldova | 100.0 /100 | #19 | Exceptional 11.2% |
| Ethiopians | 100.0 /100 | #20 | Exceptional 11.2% |
| Asians | 100.0 /100 | #21 | Exceptional 11.2% |
| Immigrants | Pakistan | 100.0 /100 | #22 | Exceptional 11.2% |
| Bolivians | 100.0 /100 | #23 | Exceptional 11.2% |
| Indians (Asian) | 100.0 /100 | #24 | Exceptional 11.3% |
| Maltese | 100.0 /100 | #25 | Exceptional 11.3% |
| Immigrants | Japan | 100.0 /100 | #26 | Exceptional 11.3% |
| Immigrants | China | 100.0 /100 | #27 | Exceptional 11.4% |
| Immigrants | Asia | 100.0 /100 | #28 | Exceptional 11.4% |
| Immigrants | Egypt | 100.0 /100 | #29 | Exceptional 11.4% |
| Iranians | 100.0 /100 | #30 | Exceptional 11.4% |
| Immigrants | Iran | 100.0 /100 | #31 | Exceptional 11.4% |
| Immigrants | Eastern Asia | 100.0 /100 | #32 | Exceptional 11.4% |
| Immigrants | Vietnam | 100.0 /100 | #33 | Exceptional 11.4% |