Israeli vs Assyrian/Chaldean/Syriac Female Unemployment
COMPARE
Israeli
Assyrian/Chaldean/Syriac
Female Unemployment
Female Unemployment Comparison
Israelis
Assyrians/Chaldeans/Syriacs
5.5%
FEMALE UNEMPLOYMENT
4.8/ 100
METRIC RATING
228th/ 347
METRIC RANK
5.6%
FEMALE UNEMPLOYMENT
0.8/ 100
METRIC RATING
251st/ 347
METRIC RANK
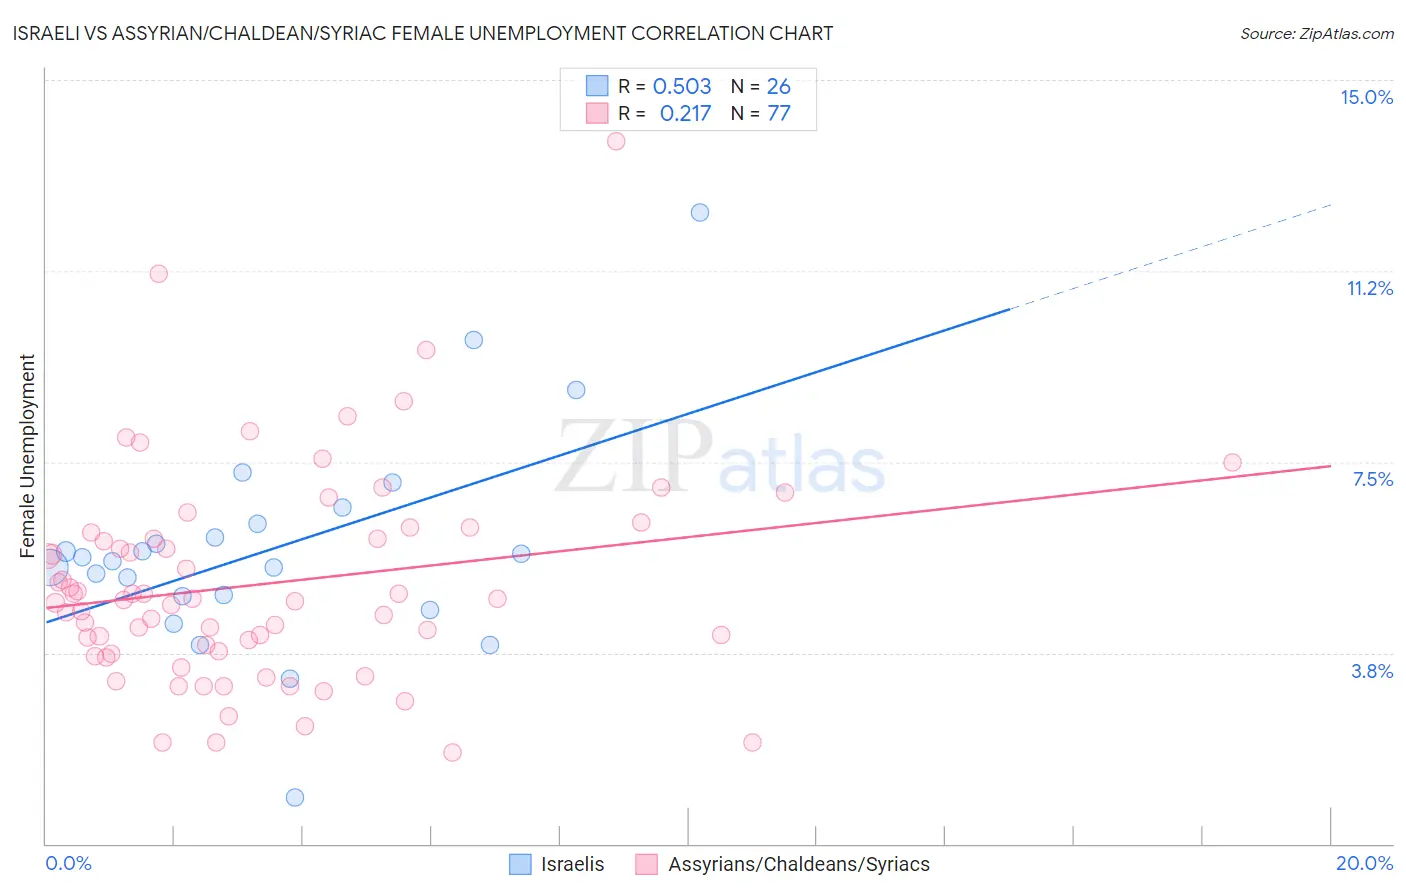
Israeli vs Assyrian/Chaldean/Syriac Female Unemployment Correlation Chart
The statistical analysis conducted on geographies consisting of 210,819,653 people shows a substantial positive correlation between the proportion of Israelis and unemploymnet rate among females in the United States with a correlation coefficient (R) of 0.503 and weighted average of 5.5%. Similarly, the statistical analysis conducted on geographies consisting of 110,254,844 people shows a weak positive correlation between the proportion of Assyrians/Chaldeans/Syriacs and unemploymnet rate among females in the United States with a correlation coefficient (R) of 0.217 and weighted average of 5.6%, a difference of 2.7%.
Female Unemployment Correlation Summary
| Measurement | Israeli | Assyrian/Chaldean/Syriac |
| Minimum | 0.90% | 1.8% |
| Maximum | 12.4% | 13.8% |
| Range | 11.5% | 12.0% |
| Mean | 5.8% | 5.1% |
| Median | 5.6% | 4.8% |
| Interquartile 25% (IQ1) | 4.9% | 3.8% |
| Interquartile 75% (IQ3) | 6.3% | 6.1% |
| Interquartile Range (IQR) | 1.4% | 2.3% |
| Standard Deviation (Sample) | 2.2% | 2.1% |
| Standard Deviation (Population) | 2.1% | 2.1% |
Similar Demographics by Female Unemployment
Demographics Similar to Israelis by Female Unemployment
In terms of female unemployment, the demographic groups most similar to Israelis are Panamanian (5.5%, a difference of 0.010%), Immigrants from Uruguay (5.5%, a difference of 0.020%), Immigrants from Philippines (5.5%, a difference of 0.16%), Immigrants from Iraq (5.5%, a difference of 0.30%), and Liberian (5.5%, a difference of 0.30%).
| Demographics | Rating | Rank | Female Unemployment |
| Brazilians | 7.3 /100 | #221 | Tragic 5.5% |
| Nicaraguans | 7.2 /100 | #222 | Tragic 5.5% |
| Delaware | 7.2 /100 | #223 | Tragic 5.5% |
| Iraqis | 7.1 /100 | #224 | Tragic 5.5% |
| French American Indians | 6.1 /100 | #225 | Tragic 5.5% |
| Immigrants | Peru | 5.9 /100 | #226 | Tragic 5.5% |
| Immigrants | Philippines | 5.3 /100 | #227 | Tragic 5.5% |
| Israelis | 4.8 /100 | #228 | Tragic 5.5% |
| Panamanians | 4.7 /100 | #229 | Tragic 5.5% |
| Immigrants | Uruguay | 4.7 /100 | #230 | Tragic 5.5% |
| Immigrants | Iraq | 3.9 /100 | #231 | Tragic 5.5% |
| Liberians | 3.9 /100 | #232 | Tragic 5.5% |
| Moroccans | 3.4 /100 | #233 | Tragic 5.5% |
| Immigrants | Lebanon | 3.3 /100 | #234 | Tragic 5.5% |
| Immigrants | Iran | 3.3 /100 | #235 | Tragic 5.5% |
Demographics Similar to Assyrians/Chaldeans/Syriacs by Female Unemployment
In terms of female unemployment, the demographic groups most similar to Assyrians/Chaldeans/Syriacs are Immigrants from Syria (5.6%, a difference of 0.060%), Cajun (5.7%, a difference of 0.20%), Immigrants from Sierra Leone (5.7%, a difference of 0.34%), Immigrants (5.7%, a difference of 0.34%), and Immigrants from Uzbekistan (5.6%, a difference of 0.35%).
| Demographics | Rating | Rank | Female Unemployment |
| Immigrants | Liberia | 1.5 /100 | #244 | Tragic 5.6% |
| Guamanians/Chamorros | 1.4 /100 | #245 | Tragic 5.6% |
| Japanese | 1.2 /100 | #246 | Tragic 5.6% |
| Immigrants | Western Asia | 1.1 /100 | #247 | Tragic 5.6% |
| Cree | 1.0 /100 | #248 | Tragic 5.6% |
| Immigrants | Uzbekistan | 1.0 /100 | #249 | Tragic 5.6% |
| Immigrants | Syria | 0.8 /100 | #250 | Tragic 5.6% |
| Assyrians/Chaldeans/Syriacs | 0.8 /100 | #251 | Tragic 5.6% |
| Cajuns | 0.7 /100 | #252 | Tragic 5.7% |
| Immigrants | Sierra Leone | 0.6 /100 | #253 | Tragic 5.7% |
| Immigrants | Immigrants | 0.6 /100 | #254 | Tragic 5.7% |
| Immigrants | Cameroon | 0.6 /100 | #255 | Tragic 5.7% |
| Sub-Saharan Africans | 0.4 /100 | #256 | Tragic 5.7% |
| Dutch West Indians | 0.3 /100 | #257 | Tragic 5.7% |
| Immigrants | Portugal | 0.2 /100 | #258 | Tragic 5.8% |