Swiss vs Immigrants from Cameroon Single Mother Poverty
COMPARE
Swiss
Immigrants from Cameroon
Single Mother Poverty
Single Mother Poverty Comparison
Swiss
Immigrants from Cameroon
29.7%
SINGLE MOTHER POVERTY
17.2/ 100
METRIC RATING
203rd/ 347
METRIC RANK
27.6%
SINGLE MOTHER POVERTY
98.8/ 100
METRIC RATING
82nd/ 347
METRIC RANK
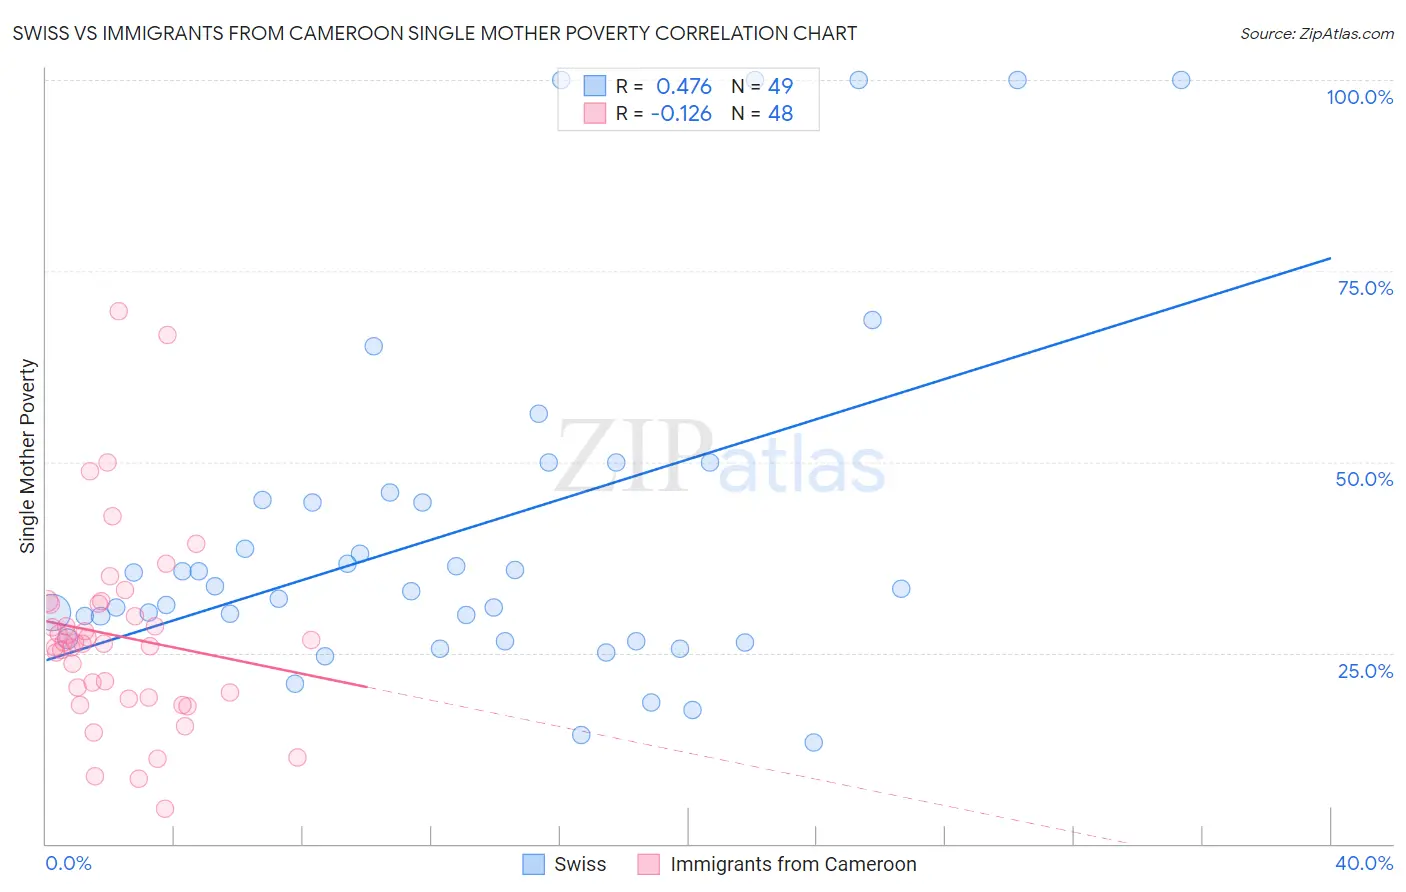
Swiss vs Immigrants from Cameroon Single Mother Poverty Correlation Chart
The statistical analysis conducted on geographies consisting of 448,256,315 people shows a moderate positive correlation between the proportion of Swiss and poverty level among single mothers in the United States with a correlation coefficient (R) of 0.476 and weighted average of 29.7%. Similarly, the statistical analysis conducted on geographies consisting of 129,897,346 people shows a poor negative correlation between the proportion of Immigrants from Cameroon and poverty level among single mothers in the United States with a correlation coefficient (R) of -0.126 and weighted average of 27.6%, a difference of 7.5%.
Single Mother Poverty Correlation Summary
| Measurement | Swiss | Immigrants from Cameroon |
| Minimum | 13.3% | 4.5% |
| Maximum | 100.0% | 69.7% |
| Range | 86.7% | 65.2% |
| Mean | 41.0% | 27.2% |
| Median | 33.3% | 26.3% |
| Interquartile 25% (IQ1) | 26.7% | 19.5% |
| Interquartile 75% (IQ3) | 45.5% | 31.4% |
| Interquartile Range (IQR) | 18.8% | 11.9% |
| Standard Deviation (Sample) | 23.1% | 12.7% |
| Standard Deviation (Population) | 22.8% | 12.6% |
Similar Demographics by Single Mother Poverty
Demographics Similar to Swiss by Single Mother Poverty
In terms of single mother poverty, the demographic groups most similar to Swiss are Malaysian (29.7%, a difference of 0.020%), Immigrants (29.7%, a difference of 0.050%), Czechoslovakian (29.7%, a difference of 0.10%), Belgian (29.7%, a difference of 0.12%), and Immigrants from Haiti (29.7%, a difference of 0.12%).
| Demographics | Rating | Rank | Single Mother Poverty |
| Spanish American Indians | 23.4 /100 | #196 | Fair 29.6% |
| Immigrants | Jamaica | 22.0 /100 | #197 | Fair 29.6% |
| Trinidadians and Tobagonians | 21.7 /100 | #198 | Fair 29.6% |
| Cubans | 20.8 /100 | #199 | Fair 29.6% |
| Panamanians | 20.0 /100 | #200 | Fair 29.6% |
| Belgians | 18.8 /100 | #201 | Poor 29.7% |
| Malaysians | 17.4 /100 | #202 | Poor 29.7% |
| Swiss | 17.2 /100 | #203 | Poor 29.7% |
| Immigrants | Immigrants | 16.6 /100 | #204 | Poor 29.7% |
| Czechoslovakians | 16.1 /100 | #205 | Poor 29.7% |
| Immigrants | Haiti | 15.8 /100 | #206 | Poor 29.7% |
| Immigrants | Panama | 15.5 /100 | #207 | Poor 29.8% |
| Immigrants | Guyana | 14.7 /100 | #208 | Poor 29.8% |
| Irish | 13.9 /100 | #209 | Poor 29.8% |
| Haitians | 13.3 /100 | #210 | Poor 29.8% |
Demographics Similar to Immigrants from Cameroon by Single Mother Poverty
In terms of single mother poverty, the demographic groups most similar to Immigrants from Cameroon are Greek (27.7%, a difference of 0.050%), Immigrants from Latvia (27.7%, a difference of 0.090%), Mongolian (27.7%, a difference of 0.090%), Immigrants from Scotland (27.6%, a difference of 0.12%), and Immigrants from Ukraine (27.7%, a difference of 0.18%).
| Demographics | Rating | Rank | Single Mother Poverty |
| Immigrants | Sweden | 99.2 /100 | #75 | Exceptional 27.5% |
| Peruvians | 99.2 /100 | #76 | Exceptional 27.5% |
| Immigrants | Peru | 99.2 /100 | #77 | Exceptional 27.5% |
| Immigrants | North Macedonia | 99.2 /100 | #78 | Exceptional 27.5% |
| Immigrants | Italy | 99.1 /100 | #79 | Exceptional 27.5% |
| Taiwanese | 99.1 /100 | #80 | Exceptional 27.5% |
| Immigrants | Scotland | 98.9 /100 | #81 | Exceptional 27.6% |
| Immigrants | Cameroon | 98.8 /100 | #82 | Exceptional 27.6% |
| Greeks | 98.7 /100 | #83 | Exceptional 27.7% |
| Immigrants | Latvia | 98.7 /100 | #84 | Exceptional 27.7% |
| Mongolians | 98.7 /100 | #85 | Exceptional 27.7% |
| Immigrants | Ukraine | 98.6 /100 | #86 | Exceptional 27.7% |
| Afghans | 98.5 /100 | #87 | Exceptional 27.7% |
| Ethiopians | 98.4 /100 | #88 | Exceptional 27.7% |
| Immigrants | Ethiopia | 98.4 /100 | #89 | Exceptional 27.7% |