Iranian vs Immigrants from Cameroon Doctorate Degree
COMPARE
Iranian
Immigrants from Cameroon
Doctorate Degree
Doctorate Degree Comparison
Iranians
Immigrants from Cameroon
3.1%
DOCTORATE DEGREE
100.0/ 100
METRIC RATING
5th/ 347
METRIC RANK
2.0%
DOCTORATE DEGREE
88.9/ 100
METRIC RATING
134th/ 347
METRIC RANK
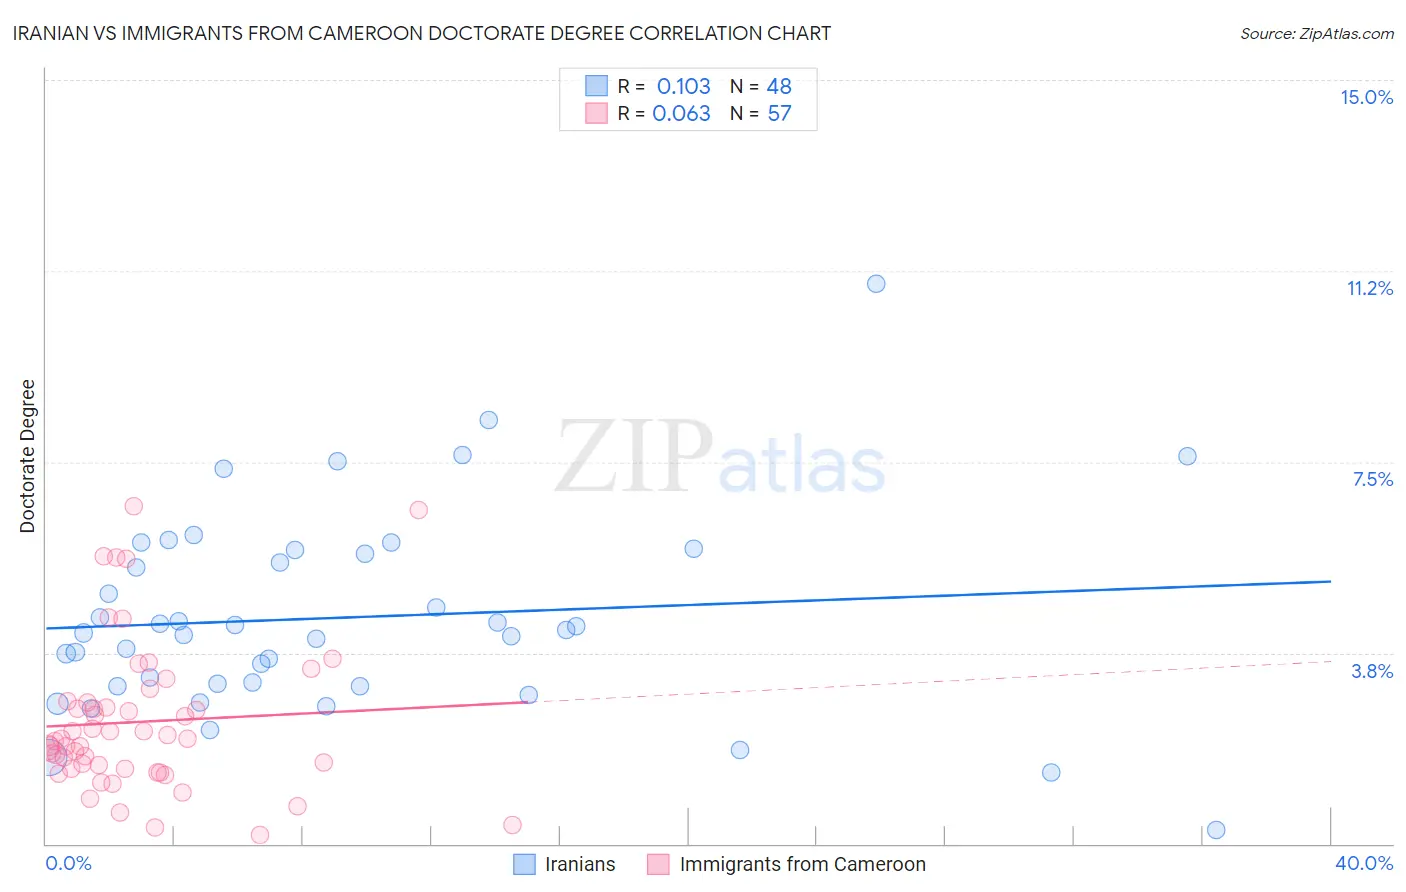
Iranian vs Immigrants from Cameroon Doctorate Degree Correlation Chart
The statistical analysis conducted on geographies consisting of 315,770,820 people shows a poor positive correlation between the proportion of Iranians and percentage of population with at least doctorate degree education in the United States with a correlation coefficient (R) of 0.103 and weighted average of 3.1%. Similarly, the statistical analysis conducted on geographies consisting of 130,429,472 people shows a slight positive correlation between the proportion of Immigrants from Cameroon and percentage of population with at least doctorate degree education in the United States with a correlation coefficient (R) of 0.063 and weighted average of 2.0%, a difference of 59.1%.
Doctorate Degree Correlation Summary
| Measurement | Iranian | Immigrants from Cameroon |
| Minimum | 0.26% | 0.17% |
| Maximum | 11.0% | 6.6% |
| Range | 10.7% | 6.5% |
| Mean | 4.4% | 2.4% |
| Median | 4.2% | 2.1% |
| Interquartile 25% (IQ1) | 3.1% | 1.5% |
| Interquartile 75% (IQ3) | 5.7% | 2.8% |
| Interquartile Range (IQR) | 2.6% | 1.3% |
| Standard Deviation (Sample) | 2.0% | 1.5% |
| Standard Deviation (Population) | 2.0% | 1.4% |
Similar Demographics by Doctorate Degree
Demographics Similar to Iranians by Doctorate Degree
In terms of doctorate degree, the demographic groups most similar to Iranians are Immigrants from Taiwan (3.2%, a difference of 1.5%), Immigrants from Switzerland (3.1%, a difference of 1.9%), Immigrants from China (3.1%, a difference of 2.0%), Immigrants from Israel (3.0%, a difference of 3.3%), and Immigrants from Iran (3.0%, a difference of 4.0%).
| Demographics | Rating | Rank | Doctorate Degree |
| Immigrants | Singapore | 100.0 /100 | #1 | Exceptional 3.7% |
| Filipinos | 100.0 /100 | #2 | Exceptional 3.4% |
| Okinawans | 100.0 /100 | #3 | Exceptional 3.3% |
| Immigrants | Taiwan | 100.0 /100 | #4 | Exceptional 3.2% |
| Iranians | 100.0 /100 | #5 | Exceptional 3.1% |
| Immigrants | Switzerland | 100.0 /100 | #6 | Exceptional 3.1% |
| Immigrants | China | 100.0 /100 | #7 | Exceptional 3.1% |
| Immigrants | Israel | 100.0 /100 | #8 | Exceptional 3.0% |
| Immigrants | Iran | 100.0 /100 | #9 | Exceptional 3.0% |
| Immigrants | Eastern Asia | 100.0 /100 | #10 | Exceptional 3.0% |
| Indians (Asian) | 100.0 /100 | #11 | Exceptional 2.9% |
| Immigrants | Belgium | 100.0 /100 | #12 | Exceptional 2.9% |
| Immigrants | Sweden | 100.0 /100 | #13 | Exceptional 2.9% |
| Immigrants | France | 100.0 /100 | #14 | Exceptional 2.9% |
| Immigrants | India | 100.0 /100 | #15 | Exceptional 2.8% |
Demographics Similar to Immigrants from Cameroon by Doctorate Degree
In terms of doctorate degree, the demographic groups most similar to Immigrants from Cameroon are Serbian (2.0%, a difference of 0.060%), Immigrants from Uzbekistan (2.0%, a difference of 0.15%), Scottish (2.0%, a difference of 0.20%), Swedish (2.0%, a difference of 0.21%), and South American Indian (2.0%, a difference of 0.21%).
| Demographics | Rating | Rank | Doctorate Degree |
| Palestinians | 92.0 /100 | #127 | Exceptional 2.0% |
| Immigrants | Zaire | 91.1 /100 | #128 | Exceptional 2.0% |
| Canadians | 90.6 /100 | #129 | Exceptional 2.0% |
| Immigrants | Ukraine | 90.5 /100 | #130 | Exceptional 2.0% |
| Immigrants | Sierra Leone | 90.2 /100 | #131 | Exceptional 2.0% |
| Scottish | 89.4 /100 | #132 | Excellent 2.0% |
| Immigrants | Uzbekistan | 89.3 /100 | #133 | Excellent 2.0% |
| Immigrants | Cameroon | 88.9 /100 | #134 | Excellent 2.0% |
| Serbians | 88.7 /100 | #135 | Excellent 2.0% |
| Swedes | 88.3 /100 | #136 | Excellent 2.0% |
| South American Indians | 88.3 /100 | #137 | Excellent 2.0% |
| Swiss | 88.0 /100 | #138 | Excellent 2.0% |
| Afghans | 87.2 /100 | #139 | Excellent 2.0% |
| Immigrants | Africa | 87.0 /100 | #140 | Excellent 2.0% |
| Senegalese | 86.7 /100 | #141 | Excellent 2.0% |