Inupiat vs Dutch Householder Income Ages 25 - 44 years
COMPARE
Inupiat
Dutch
Householder Income Ages 25 - 44 years
Householder Income Ages 25 - 44 years Comparison
Inupiat
Dutch
$84,619
HOUSEHOLDER INCOME AGES 25 - 44 YEARS
0.4/ 100
METRIC RATING
261st/ 347
METRIC RANK
$93,081
HOUSEHOLDER INCOME AGES 25 - 44 YEARS
30.5/ 100
METRIC RATING
189th/ 347
METRIC RANK
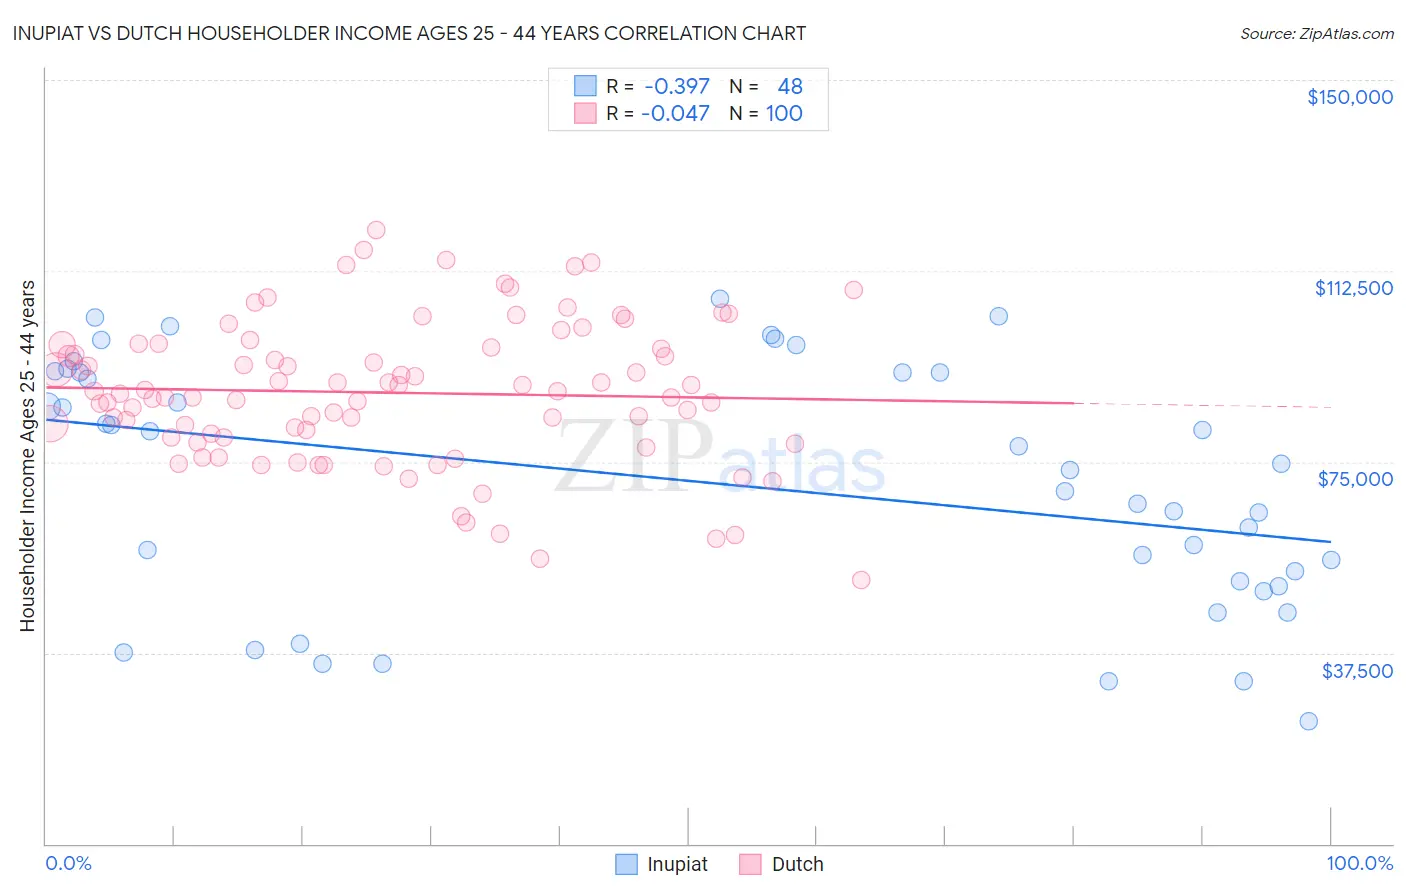
Inupiat vs Dutch Householder Income Ages 25 - 44 years Correlation Chart
The statistical analysis conducted on geographies consisting of 96,221,283 people shows a mild negative correlation between the proportion of Inupiat and household income with householder between the ages 25 and 44 in the United States with a correlation coefficient (R) of -0.397 and weighted average of $84,619. Similarly, the statistical analysis conducted on geographies consisting of 549,678,826 people shows no correlation between the proportion of Dutch and household income with householder between the ages 25 and 44 in the United States with a correlation coefficient (R) of -0.047 and weighted average of $93,081, a difference of 10.0%.
Householder Income Ages 25 - 44 years Correlation Summary
| Measurement | Inupiat | Dutch |
| Minimum | $24,167 | $51,827 |
| Maximum | $106,917 | $120,421 |
| Range | $82,750 | $68,594 |
| Mean | $70,828 | $88,577 |
| Median | $74,010 | $88,539 |
| Interquartile 25% (IQ1) | $51,032 | $79,727 |
| Interquartile 75% (IQ3) | $92,639 | $97,721 |
| Interquartile Range (IQR) | $41,608 | $17,995 |
| Standard Deviation (Sample) | $23,899 | $14,058 |
| Standard Deviation (Population) | $23,649 | $13,987 |
Similar Demographics by Householder Income Ages 25 - 44 years
Demographics Similar to Inupiat by Householder Income Ages 25 - 44 years
In terms of householder income ages 25 - 44 years, the demographic groups most similar to Inupiat are Cree ($84,574, a difference of 0.050%), Belizean ($84,534, a difference of 0.10%), Osage ($84,461, a difference of 0.19%), American ($84,791, a difference of 0.20%), and Sudanese ($84,401, a difference of 0.26%).
| Demographics | Rating | Rank | Householder Income Ages 25 - 44 years |
| Immigrants | Laos | 0.7 /100 | #254 | Tragic $85,553 |
| German Russians | 0.6 /100 | #255 | Tragic $85,220 |
| Central Americans | 0.5 /100 | #256 | Tragic $85,144 |
| Mexican American Indians | 0.5 /100 | #257 | Tragic $85,066 |
| Immigrants | Nicaragua | 0.5 /100 | #258 | Tragic $84,914 |
| Immigrants | Senegal | 0.5 /100 | #259 | Tragic $84,848 |
| Americans | 0.4 /100 | #260 | Tragic $84,791 |
| Inupiat | 0.4 /100 | #261 | Tragic $84,619 |
| Cree | 0.4 /100 | #262 | Tragic $84,574 |
| Belizeans | 0.4 /100 | #263 | Tragic $84,534 |
| Osage | 0.4 /100 | #264 | Tragic $84,461 |
| Sudanese | 0.4 /100 | #265 | Tragic $84,401 |
| Immigrants | Cabo Verde | 0.3 /100 | #266 | Tragic $84,304 |
| Hmong | 0.3 /100 | #267 | Tragic $84,258 |
| Sub-Saharan Africans | 0.3 /100 | #268 | Tragic $84,235 |
Demographics Similar to Dutch by Householder Income Ages 25 - 44 years
In terms of householder income ages 25 - 44 years, the demographic groups most similar to Dutch are Immigrants from Sierra Leone ($93,115, a difference of 0.040%), Welsh ($93,039, a difference of 0.040%), Tlingit-Haida ($92,987, a difference of 0.10%), Immigrants from Costa Rica ($92,876, a difference of 0.22%), and Spaniard ($93,366, a difference of 0.31%).
| Demographics | Rating | Rank | Householder Income Ages 25 - 44 years |
| Uruguayans | 37.3 /100 | #182 | Fair $93,631 |
| Guamanians/Chamorros | 36.5 /100 | #183 | Fair $93,569 |
| Germans | 36.0 /100 | #184 | Fair $93,531 |
| Immigrants | Eritrea | 35.2 /100 | #185 | Fair $93,466 |
| Sierra Leoneans | 34.8 /100 | #186 | Fair $93,435 |
| Spaniards | 34.0 /100 | #187 | Fair $93,366 |
| Immigrants | Sierra Leone | 30.9 /100 | #188 | Fair $93,115 |
| Dutch | 30.5 /100 | #189 | Fair $93,081 |
| Welsh | 30.0 /100 | #190 | Fair $93,039 |
| Tlingit-Haida | 29.4 /100 | #191 | Fair $92,987 |
| Immigrants | Costa Rica | 28.2 /100 | #192 | Fair $92,876 |
| Samoans | 23.0 /100 | #193 | Fair $92,385 |
| Immigrants | Azores | 22.4 /100 | #194 | Fair $92,322 |
| Celtics | 21.6 /100 | #195 | Fair $92,241 |
| Immigrants | Colombia | 21.3 /100 | #196 | Fair $92,204 |