Immigrants vs Lumbee Family Households
COMPARE
Immigrants
Lumbee
Family Households
Family Households Comparison
Immigrants
Lumbee
66.1%
FAMILY HOUSEHOLDS
100.0/ 100
METRIC RATING
55th/ 347
METRIC RANK
63.1%
FAMILY HOUSEHOLDS
0.3/ 100
METRIC RATING
274th/ 347
METRIC RANK
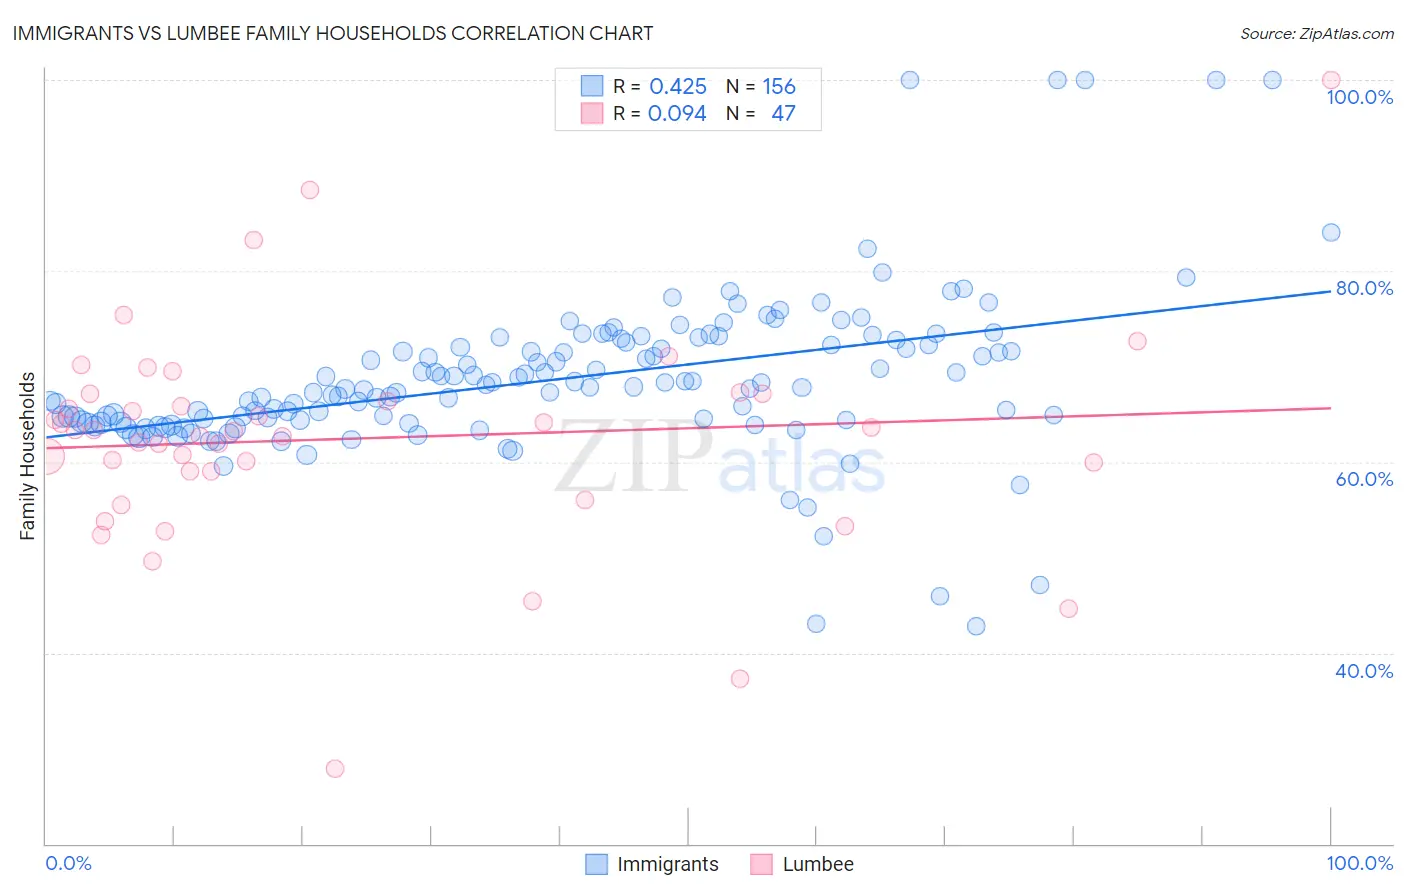
Immigrants vs Lumbee Family Households Correlation Chart
The statistical analysis conducted on geographies consisting of 577,097,366 people shows a moderate positive correlation between the proportion of Immigrants and percentage of family households in the United States with a correlation coefficient (R) of 0.425 and weighted average of 66.1%. Similarly, the statistical analysis conducted on geographies consisting of 92,265,071 people shows a slight positive correlation between the proportion of Lumbee and percentage of family households in the United States with a correlation coefficient (R) of 0.094 and weighted average of 63.1%, a difference of 4.9%.
Family Households Correlation Summary
| Measurement | Immigrants | Lumbee |
| Minimum | 42.8% | 27.9% |
| Maximum | 100.0% | 100.0% |
| Range | 57.2% | 72.1% |
| Mean | 68.6% | 62.4% |
| Median | 67.8% | 63.1% |
| Interquartile 25% (IQ1) | 64.2% | 59.0% |
| Interquartile 75% (IQ3) | 72.4% | 67.2% |
| Interquartile Range (IQR) | 8.2% | 8.2% |
| Standard Deviation (Sample) | 8.6% | 11.7% |
| Standard Deviation (Population) | 8.5% | 11.5% |
Similar Demographics by Family Households
Demographics Similar to Immigrants by Family Households
In terms of family households, the demographic groups most similar to Immigrants are Immigrants from Hong Kong (66.1%, a difference of 0.010%), Pennsylvania German (66.1%, a difference of 0.030%), Immigrants from Asia (66.1%, a difference of 0.14%), Immigrants from Korea (66.0%, a difference of 0.15%), and South American (66.0%, a difference of 0.16%).
| Demographics | Rating | Rank | Family Households |
| Immigrants | Venezuela | 100.0 /100 | #48 | Exceptional 66.4% |
| Immigrants | South Central Asia | 100.0 /100 | #49 | Exceptional 66.4% |
| Navajo | 100.0 /100 | #50 | Exceptional 66.4% |
| Natives/Alaskans | 100.0 /100 | #51 | Exceptional 66.4% |
| Colombians | 100.0 /100 | #52 | Exceptional 66.3% |
| Afghans | 100.0 /100 | #53 | Exceptional 66.3% |
| Immigrants | Colombia | 100.0 /100 | #54 | Exceptional 66.3% |
| Immigrants | Immigrants | 100.0 /100 | #55 | Exceptional 66.1% |
| Immigrants | Hong Kong | 100.0 /100 | #56 | Exceptional 66.1% |
| Pennsylvania Germans | 100.0 /100 | #57 | Exceptional 66.1% |
| Immigrants | Asia | 100.0 /100 | #58 | Exceptional 66.1% |
| Immigrants | Korea | 100.0 /100 | #59 | Exceptional 66.0% |
| South Americans | 100.0 /100 | #60 | Exceptional 66.0% |
| Danes | 100.0 /100 | #61 | Exceptional 66.0% |
| Central Americans | 100.0 /100 | #62 | Exceptional 66.0% |
Demographics Similar to Lumbee by Family Households
In terms of family households, the demographic groups most similar to Lumbee are West Indian (63.1%, a difference of 0.0%), Immigrants from Kazakhstan (63.1%, a difference of 0.010%), Serbian (63.0%, a difference of 0.010%), Immigrants from Croatia (63.1%, a difference of 0.020%), and Immigrants from Turkey (63.1%, a difference of 0.020%).
| Demographics | Rating | Rank | Family Households |
| Israelis | 0.4 /100 | #267 | Tragic 63.1% |
| Immigrants | Singapore | 0.4 /100 | #268 | Tragic 63.1% |
| Yugoslavians | 0.4 /100 | #269 | Tragic 63.1% |
| Immigrants | Austria | 0.3 /100 | #270 | Tragic 63.1% |
| Immigrants | Croatia | 0.3 /100 | #271 | Tragic 63.1% |
| Immigrants | Turkey | 0.3 /100 | #272 | Tragic 63.1% |
| Immigrants | Kazakhstan | 0.3 /100 | #273 | Tragic 63.1% |
| Lumbee | 0.3 /100 | #274 | Tragic 63.1% |
| West Indians | 0.3 /100 | #275 | Tragic 63.1% |
| Serbians | 0.3 /100 | #276 | Tragic 63.0% |
| Ottawa | 0.3 /100 | #277 | Tragic 63.0% |
| Immigrants | Belgium | 0.2 /100 | #278 | Tragic 63.0% |
| Immigrants | Yemen | 0.2 /100 | #279 | Tragic 63.0% |
| Immigrants | Bulgaria | 0.2 /100 | #280 | Tragic 63.0% |
| Estonians | 0.2 /100 | #281 | Tragic 62.9% |