Immigrants from Zimbabwe vs Immigrants from Germany Poverty
COMPARE
Immigrants from Zimbabwe
Immigrants from Germany
Poverty
Poverty Comparison
Immigrants from Zimbabwe
Immigrants from Germany
11.6%
POVERTY
92.1/ 100
METRIC RATING
106th/ 347
METRIC RANK
12.0%
POVERTY
72.7/ 100
METRIC RATING
148th/ 347
METRIC RANK
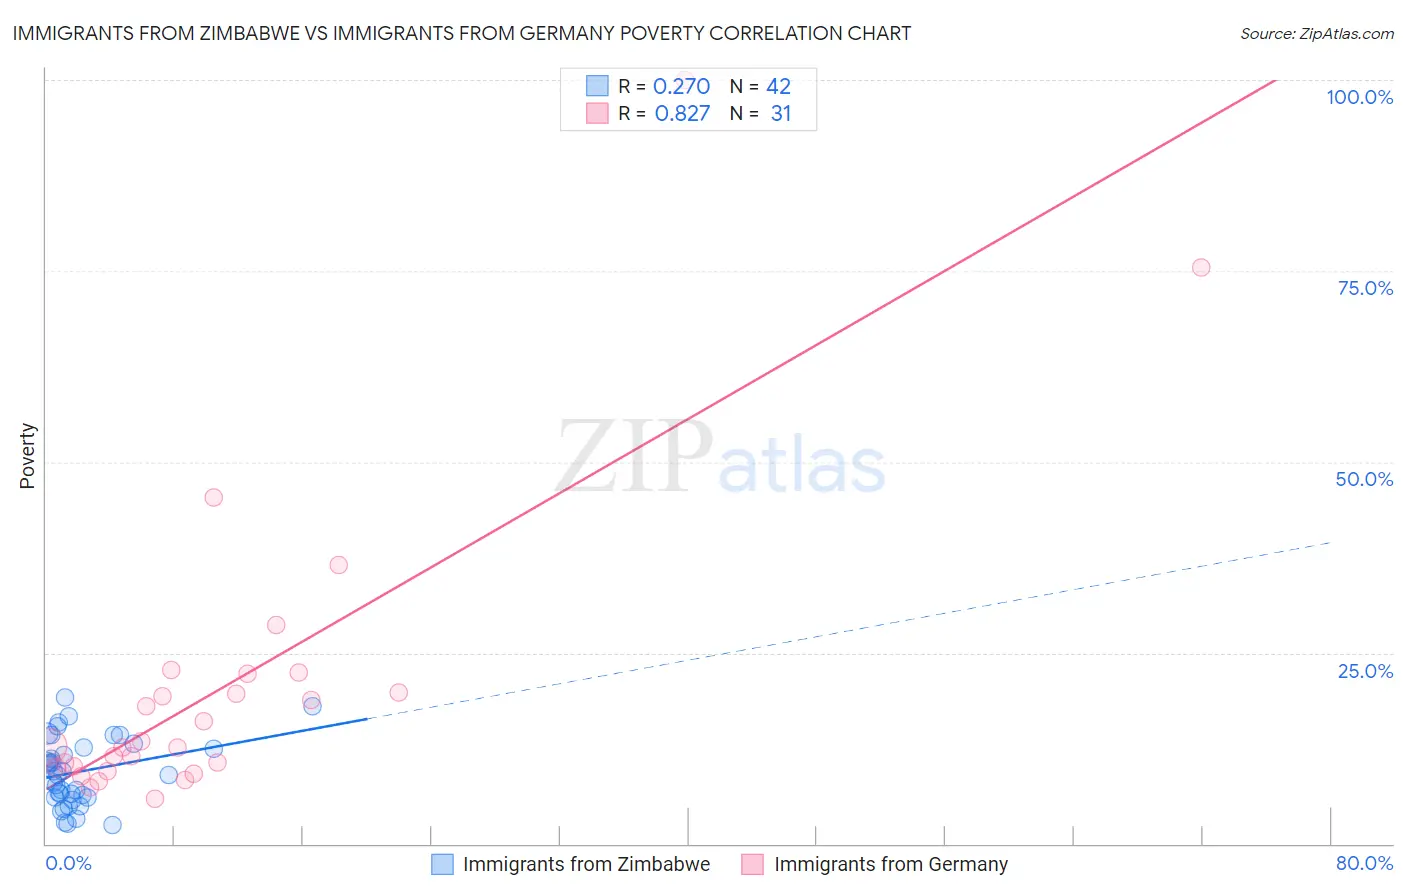
Immigrants from Zimbabwe vs Immigrants from Germany Poverty Correlation Chart
The statistical analysis conducted on geographies consisting of 117,789,316 people shows a weak positive correlation between the proportion of Immigrants from Zimbabwe and poverty level in the United States with a correlation coefficient (R) of 0.270 and weighted average of 11.6%. Similarly, the statistical analysis conducted on geographies consisting of 463,719,504 people shows a very strong positive correlation between the proportion of Immigrants from Germany and poverty level in the United States with a correlation coefficient (R) of 0.827 and weighted average of 12.0%, a difference of 3.8%.
Poverty Correlation Summary
| Measurement | Immigrants from Zimbabwe | Immigrants from Germany |
| Minimum | 2.4% | 5.8% |
| Maximum | 19.2% | 100.0% |
| Range | 16.7% | 94.2% |
| Mean | 9.5% | 20.6% |
| Median | 9.3% | 12.7% |
| Interquartile 25% (IQ1) | 6.1% | 10.0% |
| Interquartile 75% (IQ3) | 12.7% | 22.3% |
| Interquartile Range (IQR) | 6.6% | 12.3% |
| Standard Deviation (Sample) | 4.4% | 20.2% |
| Standard Deviation (Population) | 4.4% | 19.8% |
Similar Demographics by Poverty
Demographics Similar to Immigrants from Zimbabwe by Poverty
In terms of poverty, the demographic groups most similar to Immigrants from Zimbabwe are Portuguese (11.6%, a difference of 0.0%), Native Hawaiian (11.6%, a difference of 0.020%), Palestinian (11.6%, a difference of 0.090%), Canadian (11.6%, a difference of 0.12%), and Laotian (11.6%, a difference of 0.13%).
| Demographics | Rating | Rank | Poverty |
| Immigrants | Indonesia | 94.2 /100 | #99 | Exceptional 11.5% |
| Scottish | 94.0 /100 | #100 | Exceptional 11.5% |
| Slavs | 93.3 /100 | #101 | Exceptional 11.5% |
| Laotians | 92.4 /100 | #102 | Exceptional 11.6% |
| Okinawans | 92.4 /100 | #103 | Exceptional 11.6% |
| Native Hawaiians | 92.1 /100 | #104 | Exceptional 11.6% |
| Portuguese | 92.1 /100 | #105 | Exceptional 11.6% |
| Immigrants | Zimbabwe | 92.1 /100 | #106 | Exceptional 11.6% |
| Palestinians | 91.8 /100 | #107 | Exceptional 11.6% |
| Canadians | 91.7 /100 | #108 | Exceptional 11.6% |
| Immigrants | Turkey | 91.7 /100 | #109 | Exceptional 11.6% |
| Welsh | 91.6 /100 | #110 | Exceptional 11.6% |
| French Canadians | 91.0 /100 | #111 | Exceptional 11.6% |
| Immigrants | Southern Europe | 90.8 /100 | #112 | Exceptional 11.6% |
| Immigrants | Belarus | 90.8 /100 | #113 | Exceptional 11.6% |
Demographics Similar to Immigrants from Germany by Poverty
In terms of poverty, the demographic groups most similar to Immigrants from Germany are Immigrants from Malaysia (12.0%, a difference of 0.0%), Immigrants from Kazakhstan (12.0%, a difference of 0.050%), Samoan (12.0%, a difference of 0.10%), Immigrants from Bosnia and Herzegovina (12.0%, a difference of 0.12%), and Afghan (12.0%, a difference of 0.28%).
| Demographics | Rating | Rank | Poverty |
| Immigrants | France | 80.5 /100 | #141 | Excellent 11.9% |
| Basques | 80.4 /100 | #142 | Excellent 11.9% |
| Brazilians | 79.7 /100 | #143 | Good 11.9% |
| Icelanders | 77.9 /100 | #144 | Good 11.9% |
| Syrians | 75.1 /100 | #145 | Good 12.0% |
| Afghans | 74.9 /100 | #146 | Good 12.0% |
| Immigrants | Bosnia and Herzegovina | 73.7 /100 | #147 | Good 12.0% |
| Immigrants | Germany | 72.7 /100 | #148 | Good 12.0% |
| Immigrants | Malaysia | 72.7 /100 | #149 | Good 12.0% |
| Immigrants | Kazakhstan | 72.3 /100 | #150 | Good 12.0% |
| Samoans | 71.9 /100 | #151 | Good 12.0% |
| Armenians | 67.6 /100 | #152 | Good 12.1% |
| Immigrants | Northern Africa | 63.9 /100 | #153 | Good 12.1% |
| Guamanians/Chamorros | 63.9 /100 | #154 | Good 12.1% |
| Hungarians | 63.6 /100 | #155 | Good 12.2% |