Immigrants from Zimbabwe vs Irish Poverty
COMPARE
Immigrants from Zimbabwe
Irish
Poverty
Poverty Comparison
Immigrants from Zimbabwe
Irish
11.6%
POVERTY
92.1/ 100
METRIC RATING
106th/ 347
METRIC RANK
11.3%
POVERTY
96.6/ 100
METRIC RATING
81st/ 347
METRIC RANK
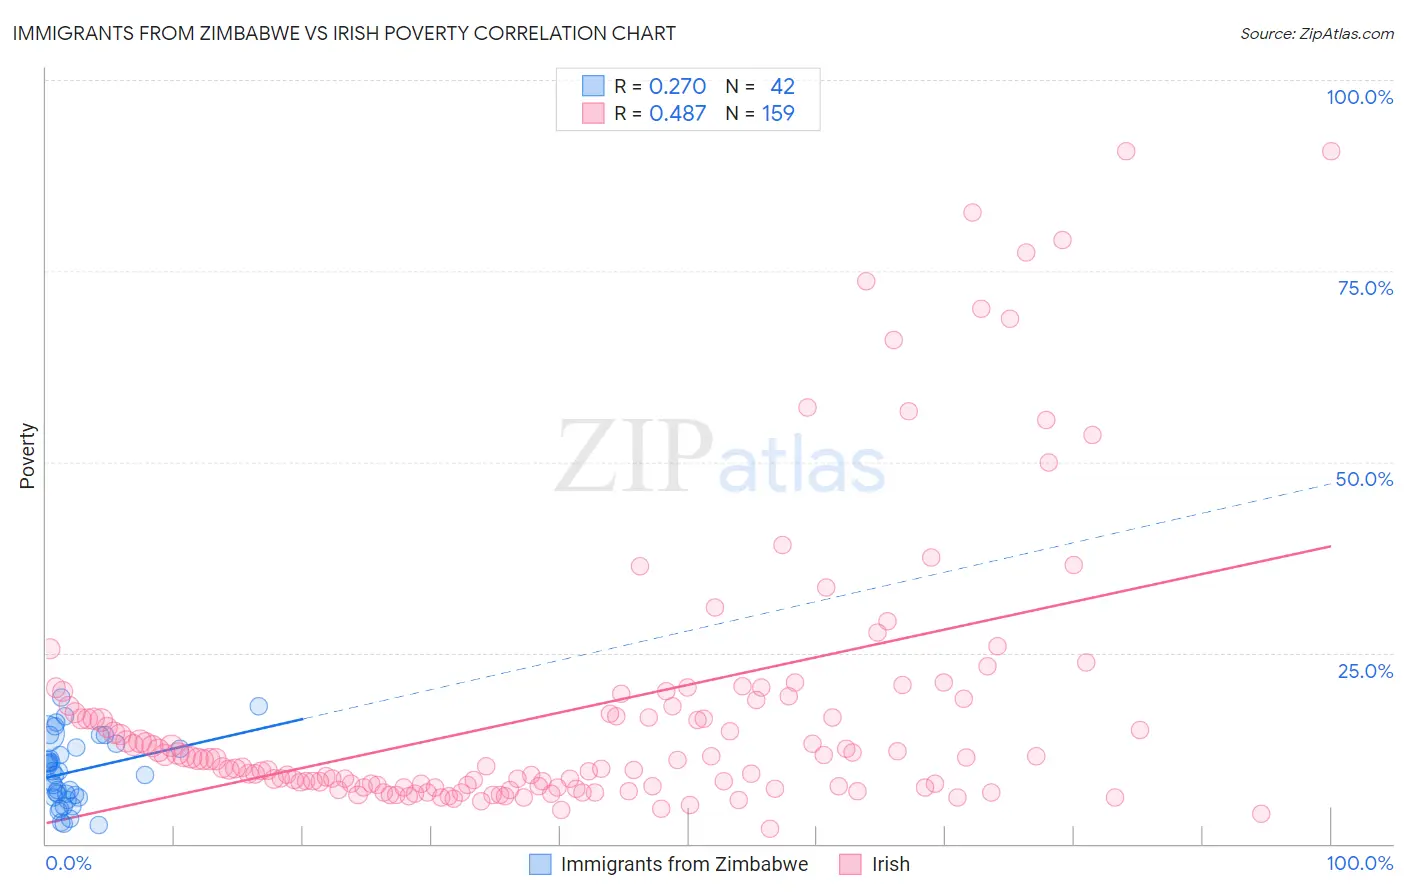
Immigrants from Zimbabwe vs Irish Poverty Correlation Chart
The statistical analysis conducted on geographies consisting of 117,789,316 people shows a weak positive correlation between the proportion of Immigrants from Zimbabwe and poverty level in the United States with a correlation coefficient (R) of 0.270 and weighted average of 11.6%. Similarly, the statistical analysis conducted on geographies consisting of 579,456,030 people shows a moderate positive correlation between the proportion of Irish and poverty level in the United States with a correlation coefficient (R) of 0.487 and weighted average of 11.3%, a difference of 2.4%.
Poverty Correlation Summary
| Measurement | Immigrants from Zimbabwe | Irish |
| Minimum | 2.4% | 2.0% |
| Maximum | 19.2% | 90.7% |
| Range | 16.7% | 88.7% |
| Mean | 9.5% | 17.4% |
| Median | 9.3% | 11.0% |
| Interquartile 25% (IQ1) | 6.1% | 7.5% |
| Interquartile 75% (IQ3) | 12.7% | 18.1% |
| Interquartile Range (IQR) | 6.6% | 10.6% |
| Standard Deviation (Sample) | 4.4% | 18.1% |
| Standard Deviation (Population) | 4.4% | 18.0% |
Similar Demographics by Poverty
Demographics Similar to Immigrants from Zimbabwe by Poverty
In terms of poverty, the demographic groups most similar to Immigrants from Zimbabwe are Portuguese (11.6%, a difference of 0.0%), Native Hawaiian (11.6%, a difference of 0.020%), Palestinian (11.6%, a difference of 0.090%), Canadian (11.6%, a difference of 0.12%), and Laotian (11.6%, a difference of 0.13%).
| Demographics | Rating | Rank | Poverty |
| Immigrants | Indonesia | 94.2 /100 | #99 | Exceptional 11.5% |
| Scottish | 94.0 /100 | #100 | Exceptional 11.5% |
| Slavs | 93.3 /100 | #101 | Exceptional 11.5% |
| Laotians | 92.4 /100 | #102 | Exceptional 11.6% |
| Okinawans | 92.4 /100 | #103 | Exceptional 11.6% |
| Native Hawaiians | 92.1 /100 | #104 | Exceptional 11.6% |
| Portuguese | 92.1 /100 | #105 | Exceptional 11.6% |
| Immigrants | Zimbabwe | 92.1 /100 | #106 | Exceptional 11.6% |
| Palestinians | 91.8 /100 | #107 | Exceptional 11.6% |
| Canadians | 91.7 /100 | #108 | Exceptional 11.6% |
| Immigrants | Turkey | 91.7 /100 | #109 | Exceptional 11.6% |
| Welsh | 91.6 /100 | #110 | Exceptional 11.6% |
| French Canadians | 91.0 /100 | #111 | Exceptional 11.6% |
| Immigrants | Southern Europe | 90.8 /100 | #112 | Exceptional 11.6% |
| Immigrants | Belarus | 90.8 /100 | #113 | Exceptional 11.6% |
Demographics Similar to Irish by Poverty
In terms of poverty, the demographic groups most similar to Irish are Indian (Asian) (11.3%, a difference of 0.0%), Cambodian (11.3%, a difference of 0.020%), Dutch (11.3%, a difference of 0.070%), Immigrants from Eastern Asia (11.3%, a difference of 0.080%), and Egyptian (11.3%, a difference of 0.090%).
| Demographics | Rating | Rank | Poverty |
| Carpatho Rusyns | 97.2 /100 | #74 | Exceptional 11.3% |
| Immigrants | Eastern Europe | 97.0 /100 | #75 | Exceptional 11.3% |
| Immigrants | North America | 96.8 /100 | #76 | Exceptional 11.3% |
| Immigrants | Eastern Asia | 96.7 /100 | #77 | Exceptional 11.3% |
| Dutch | 96.7 /100 | #78 | Exceptional 11.3% |
| Cambodians | 96.7 /100 | #79 | Exceptional 11.3% |
| Indians (Asian) | 96.6 /100 | #80 | Exceptional 11.3% |
| Irish | 96.6 /100 | #81 | Exceptional 11.3% |
| Egyptians | 96.5 /100 | #82 | Exceptional 11.3% |
| Immigrants | Sweden | 96.3 /100 | #83 | Exceptional 11.3% |
| English | 96.3 /100 | #84 | Exceptional 11.3% |
| Immigrants | England | 96.2 /100 | #85 | Exceptional 11.4% |
| Jordanians | 96.0 /100 | #86 | Exceptional 11.4% |
| Northern Europeans | 96.0 /100 | #87 | Exceptional 11.4% |
| Belgians | 95.8 /100 | #88 | Exceptional 11.4% |