Potawatomi vs Immigrants from Germany Poverty
COMPARE
Potawatomi
Immigrants from Germany
Poverty
Poverty Comparison
Potawatomi
Immigrants from Germany
14.1%
POVERTY
0.3/ 100
METRIC RATING
246th/ 347
METRIC RANK
12.0%
POVERTY
72.7/ 100
METRIC RATING
148th/ 347
METRIC RANK
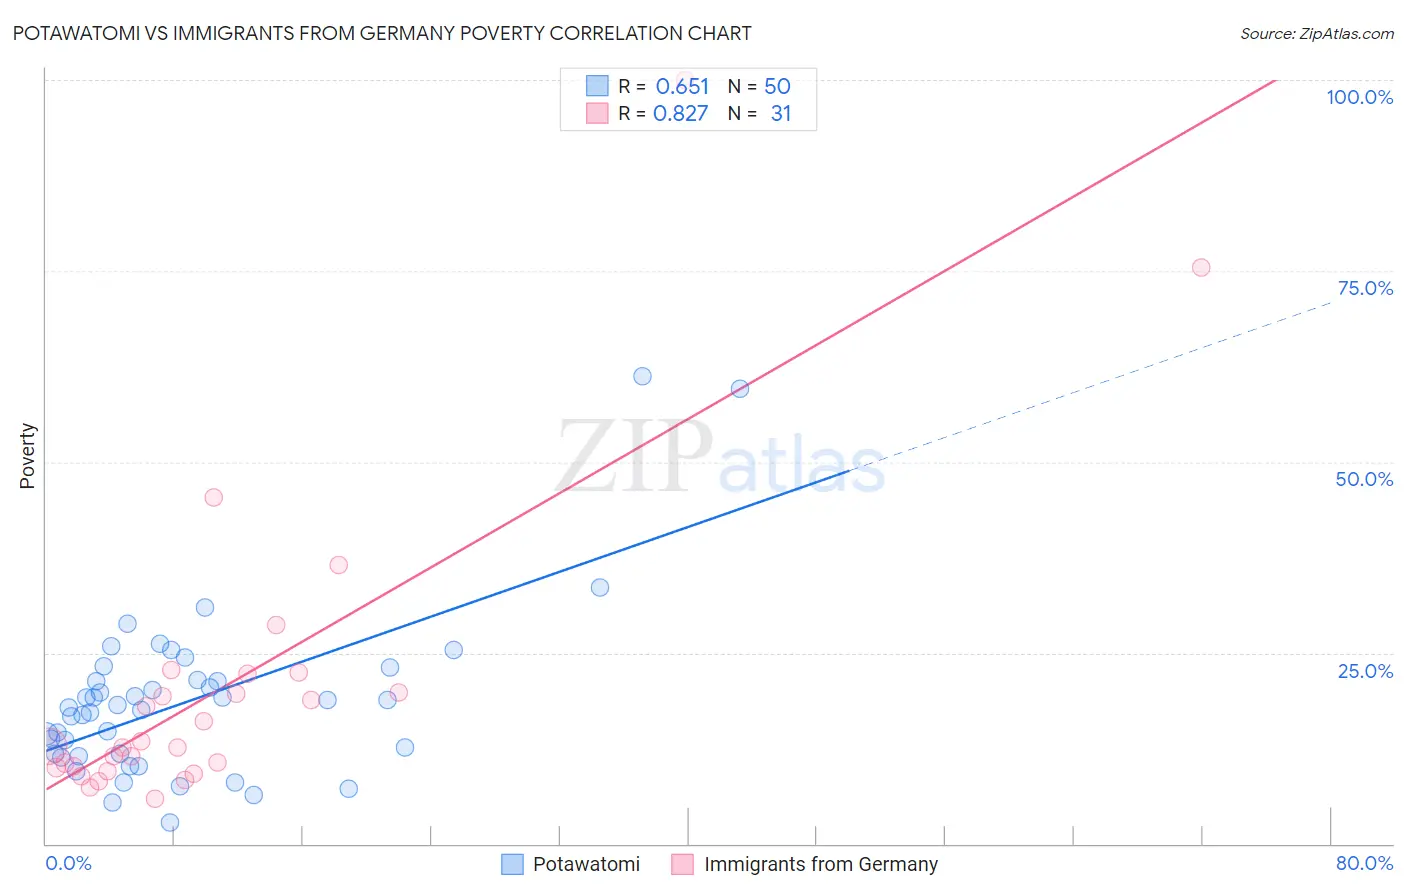
Potawatomi vs Immigrants from Germany Poverty Correlation Chart
The statistical analysis conducted on geographies consisting of 117,756,433 people shows a significant positive correlation between the proportion of Potawatomi and poverty level in the United States with a correlation coefficient (R) of 0.651 and weighted average of 14.1%. Similarly, the statistical analysis conducted on geographies consisting of 463,719,504 people shows a very strong positive correlation between the proportion of Immigrants from Germany and poverty level in the United States with a correlation coefficient (R) of 0.827 and weighted average of 12.0%, a difference of 17.2%.
Poverty Correlation Summary
| Measurement | Potawatomi | Immigrants from Germany |
| Minimum | 2.7% | 5.8% |
| Maximum | 61.3% | 100.0% |
| Range | 58.6% | 94.2% |
| Mean | 18.7% | 20.6% |
| Median | 18.0% | 12.7% |
| Interquartile 25% (IQ1) | 11.8% | 10.0% |
| Interquartile 75% (IQ3) | 21.5% | 22.3% |
| Interquartile Range (IQR) | 9.7% | 12.3% |
| Standard Deviation (Sample) | 11.0% | 20.2% |
| Standard Deviation (Population) | 10.9% | 19.8% |
Similar Demographics by Poverty
Demographics Similar to Potawatomi by Poverty
In terms of poverty, the demographic groups most similar to Potawatomi are Immigrants from Sudan (14.1%, a difference of 0.20%), Liberian (14.1%, a difference of 0.28%), Immigrants from Western Africa (14.1%, a difference of 0.30%), Immigrants from Ghana (14.2%, a difference of 0.40%), and Nepalese (14.0%, a difference of 0.59%).
| Demographics | Rating | Rank | Poverty |
| Nicaraguans | 0.4 /100 | #239 | Tragic 13.9% |
| Immigrants | Middle Africa | 0.4 /100 | #240 | Tragic 14.0% |
| Salvadorans | 0.4 /100 | #241 | Tragic 14.0% |
| Ecuadorians | 0.4 /100 | #242 | Tragic 14.0% |
| Sudanese | 0.3 /100 | #243 | Tragic 14.0% |
| Nepalese | 0.3 /100 | #244 | Tragic 14.0% |
| Immigrants | Sudan | 0.3 /100 | #245 | Tragic 14.1% |
| Potawatomi | 0.3 /100 | #246 | Tragic 14.1% |
| Liberians | 0.2 /100 | #247 | Tragic 14.1% |
| Immigrants | Western Africa | 0.2 /100 | #248 | Tragic 14.1% |
| Immigrants | Ghana | 0.2 /100 | #249 | Tragic 14.2% |
| Cree | 0.2 /100 | #250 | Tragic 14.2% |
| Immigrants | Burma/Myanmar | 0.2 /100 | #251 | Tragic 14.2% |
| Spanish American Indians | 0.2 /100 | #252 | Tragic 14.2% |
| Immigrants | Trinidad and Tobago | 0.2 /100 | #253 | Tragic 14.2% |
Demographics Similar to Immigrants from Germany by Poverty
In terms of poverty, the demographic groups most similar to Immigrants from Germany are Immigrants from Malaysia (12.0%, a difference of 0.0%), Immigrants from Kazakhstan (12.0%, a difference of 0.050%), Samoan (12.0%, a difference of 0.10%), Immigrants from Bosnia and Herzegovina (12.0%, a difference of 0.12%), and Afghan (12.0%, a difference of 0.28%).
| Demographics | Rating | Rank | Poverty |
| Immigrants | France | 80.5 /100 | #141 | Excellent 11.9% |
| Basques | 80.4 /100 | #142 | Excellent 11.9% |
| Brazilians | 79.7 /100 | #143 | Good 11.9% |
| Icelanders | 77.9 /100 | #144 | Good 11.9% |
| Syrians | 75.1 /100 | #145 | Good 12.0% |
| Afghans | 74.9 /100 | #146 | Good 12.0% |
| Immigrants | Bosnia and Herzegovina | 73.7 /100 | #147 | Good 12.0% |
| Immigrants | Germany | 72.7 /100 | #148 | Good 12.0% |
| Immigrants | Malaysia | 72.7 /100 | #149 | Good 12.0% |
| Immigrants | Kazakhstan | 72.3 /100 | #150 | Good 12.0% |
| Samoans | 71.9 /100 | #151 | Good 12.0% |
| Armenians | 67.6 /100 | #152 | Good 12.1% |
| Immigrants | Northern Africa | 63.9 /100 | #153 | Good 12.1% |
| Guamanians/Chamorros | 63.9 /100 | #154 | Good 12.1% |
| Hungarians | 63.6 /100 | #155 | Good 12.2% |