Immigrants from Poland vs Immigrants from Germany Poverty
COMPARE
Immigrants from Poland
Immigrants from Germany
Poverty
Poverty Comparison
Immigrants from Poland
Immigrants from Germany
10.8%
POVERTY
99.4/ 100
METRIC RATING
34th/ 347
METRIC RANK
12.0%
POVERTY
72.7/ 100
METRIC RATING
148th/ 347
METRIC RANK
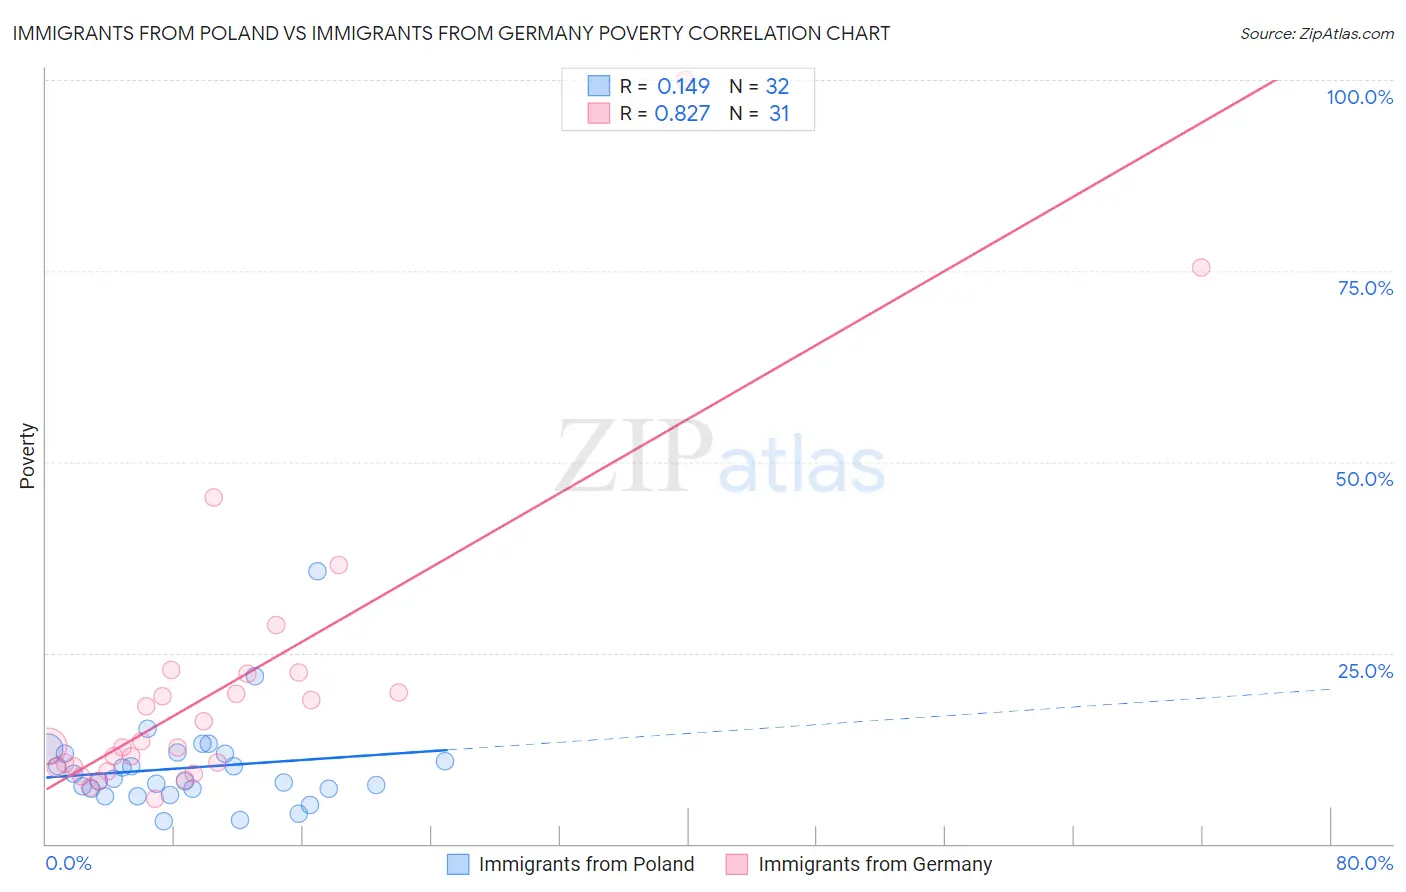
Immigrants from Poland vs Immigrants from Germany Poverty Correlation Chart
The statistical analysis conducted on geographies consisting of 304,760,939 people shows a poor positive correlation between the proportion of Immigrants from Poland and poverty level in the United States with a correlation coefficient (R) of 0.149 and weighted average of 10.8%. Similarly, the statistical analysis conducted on geographies consisting of 463,719,504 people shows a very strong positive correlation between the proportion of Immigrants from Germany and poverty level in the United States with a correlation coefficient (R) of 0.827 and weighted average of 12.0%, a difference of 11.2%.
Poverty Correlation Summary
| Measurement | Immigrants from Poland | Immigrants from Germany |
| Minimum | 2.9% | 5.8% |
| Maximum | 35.6% | 100.0% |
| Range | 32.7% | 94.2% |
| Mean | 10.0% | 20.6% |
| Median | 8.4% | 12.7% |
| Interquartile 25% (IQ1) | 7.2% | 10.0% |
| Interquartile 75% (IQ3) | 11.8% | 22.3% |
| Interquartile Range (IQR) | 4.6% | 12.3% |
| Standard Deviation (Sample) | 6.0% | 20.2% |
| Standard Deviation (Population) | 5.9% | 19.8% |
Similar Demographics by Poverty
Demographics Similar to Immigrants from Poland by Poverty
In terms of poverty, the demographic groups most similar to Immigrants from Poland are Tongan (10.8%, a difference of 0.040%), Macedonian (10.8%, a difference of 0.090%), Cypriot (10.8%, a difference of 0.12%), Immigrants from Greece (10.8%, a difference of 0.22%), and Czech (10.8%, a difference of 0.26%).
| Demographics | Rating | Rank | Poverty |
| Immigrants | Northern Europe | 99.6 /100 | #27 | Exceptional 10.7% |
| Immigrants | Korea | 99.5 /100 | #28 | Exceptional 10.7% |
| Greeks | 99.5 /100 | #29 | Exceptional 10.7% |
| Danes | 99.5 /100 | #30 | Exceptional 10.7% |
| Poles | 99.5 /100 | #31 | Exceptional 10.7% |
| Iranians | 99.5 /100 | #32 | Exceptional 10.7% |
| Macedonians | 99.4 /100 | #33 | Exceptional 10.8% |
| Immigrants | Poland | 99.4 /100 | #34 | Exceptional 10.8% |
| Tongans | 99.4 /100 | #35 | Exceptional 10.8% |
| Cypriots | 99.3 /100 | #36 | Exceptional 10.8% |
| Immigrants | Greece | 99.3 /100 | #37 | Exceptional 10.8% |
| Czechs | 99.3 /100 | #38 | Exceptional 10.8% |
| Immigrants | Pakistan | 99.3 /100 | #39 | Exceptional 10.8% |
| Russians | 99.3 /100 | #40 | Exceptional 10.9% |
| Immigrants | Iran | 99.2 /100 | #41 | Exceptional 10.9% |
Demographics Similar to Immigrants from Germany by Poverty
In terms of poverty, the demographic groups most similar to Immigrants from Germany are Immigrants from Malaysia (12.0%, a difference of 0.0%), Immigrants from Kazakhstan (12.0%, a difference of 0.050%), Samoan (12.0%, a difference of 0.10%), Immigrants from Bosnia and Herzegovina (12.0%, a difference of 0.12%), and Afghan (12.0%, a difference of 0.28%).
| Demographics | Rating | Rank | Poverty |
| Immigrants | France | 80.5 /100 | #141 | Excellent 11.9% |
| Basques | 80.4 /100 | #142 | Excellent 11.9% |
| Brazilians | 79.7 /100 | #143 | Good 11.9% |
| Icelanders | 77.9 /100 | #144 | Good 11.9% |
| Syrians | 75.1 /100 | #145 | Good 12.0% |
| Afghans | 74.9 /100 | #146 | Good 12.0% |
| Immigrants | Bosnia and Herzegovina | 73.7 /100 | #147 | Good 12.0% |
| Immigrants | Germany | 72.7 /100 | #148 | Good 12.0% |
| Immigrants | Malaysia | 72.7 /100 | #149 | Good 12.0% |
| Immigrants | Kazakhstan | 72.3 /100 | #150 | Good 12.0% |
| Samoans | 71.9 /100 | #151 | Good 12.0% |
| Armenians | 67.6 /100 | #152 | Good 12.1% |
| Immigrants | Northern Africa | 63.9 /100 | #153 | Good 12.1% |
| Guamanians/Chamorros | 63.9 /100 | #154 | Good 12.1% |
| Hungarians | 63.6 /100 | #155 | Good 12.2% |