Celtic vs Immigrants from Germany Poverty
COMPARE
Celtic
Immigrants from Germany
Poverty
Poverty Comparison
Celtics
Immigrants from Germany
12.3%
POVERTY
50.1/ 100
METRIC RATING
173rd/ 347
METRIC RANK
12.0%
POVERTY
72.7/ 100
METRIC RATING
148th/ 347
METRIC RANK
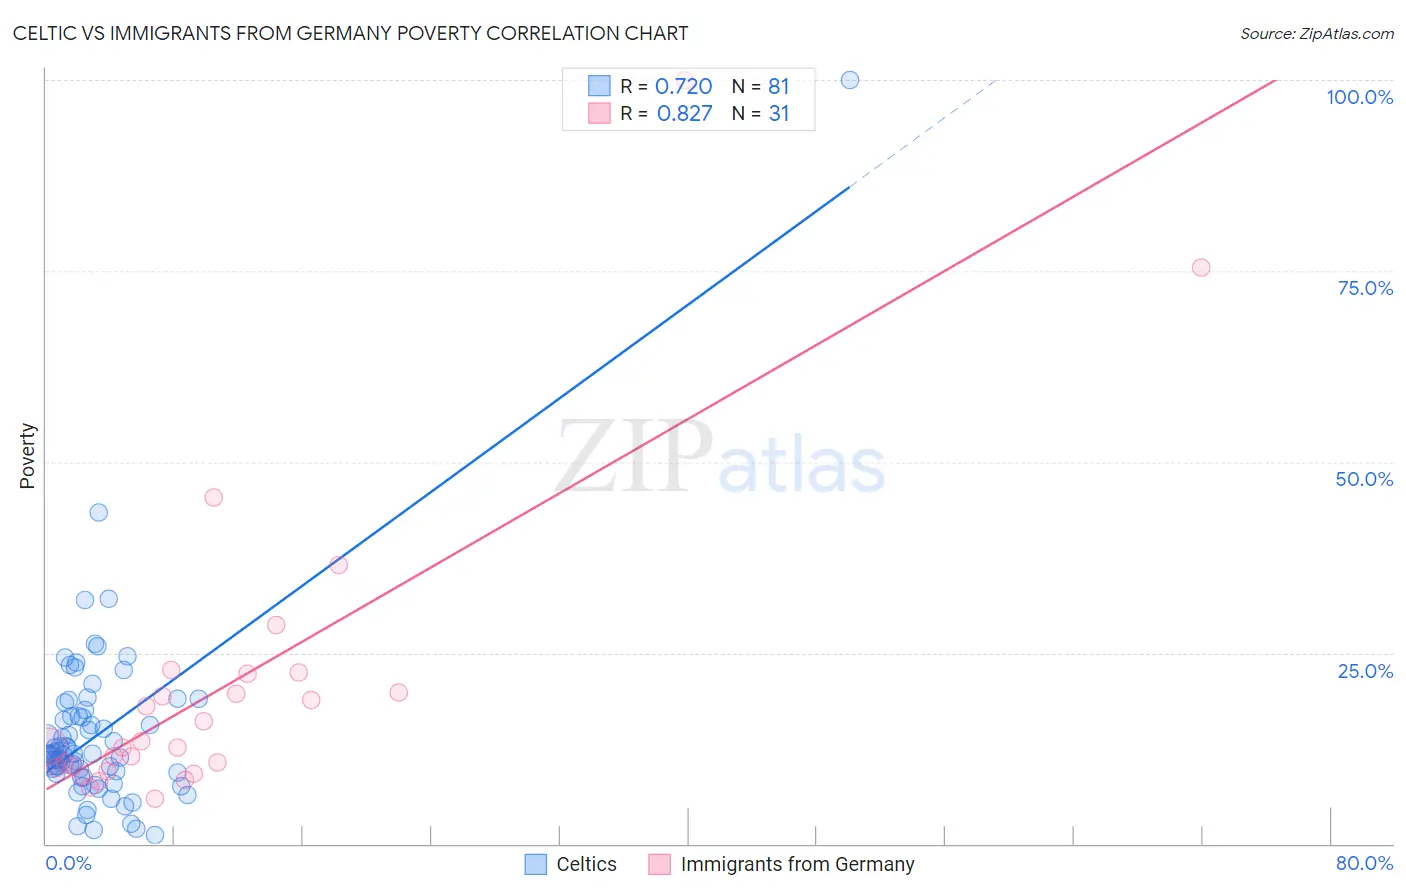
Celtic vs Immigrants from Germany Poverty Correlation Chart
The statistical analysis conducted on geographies consisting of 168,858,616 people shows a strong positive correlation between the proportion of Celtics and poverty level in the United States with a correlation coefficient (R) of 0.720 and weighted average of 12.3%. Similarly, the statistical analysis conducted on geographies consisting of 463,719,504 people shows a very strong positive correlation between the proportion of Immigrants from Germany and poverty level in the United States with a correlation coefficient (R) of 0.827 and weighted average of 12.0%, a difference of 2.4%.
Poverty Correlation Summary
| Measurement | Celtic | Immigrants from Germany |
| Minimum | 1.1% | 5.8% |
| Maximum | 100.0% | 100.0% |
| Range | 98.9% | 94.2% |
| Mean | 14.3% | 20.6% |
| Median | 11.7% | 12.7% |
| Interquartile 25% (IQ1) | 9.3% | 10.0% |
| Interquartile 75% (IQ3) | 16.7% | 22.3% |
| Interquartile Range (IQR) | 7.4% | 12.3% |
| Standard Deviation (Sample) | 12.1% | 20.2% |
| Standard Deviation (Population) | 12.1% | 19.8% |
Similar Demographics by Poverty
Demographics Similar to Celtics by Poverty
In terms of poverty, the demographic groups most similar to Celtics are Lebanese (12.3%, a difference of 0.010%), Immigrants from Portugal (12.3%, a difference of 0.040%), Immigrants from Spain (12.3%, a difference of 0.11%), South American (12.3%, a difference of 0.14%), and Immigrants from Colombia (12.3%, a difference of 0.24%).
| Demographics | Rating | Rank | Poverty |
| Venezuelans | 56.9 /100 | #166 | Average 12.2% |
| Immigrants | Chile | 56.7 /100 | #167 | Average 12.2% |
| Immigrants | Venezuela | 56.5 /100 | #168 | Average 12.2% |
| Whites/Caucasians | 55.4 /100 | #169 | Average 12.3% |
| Immigrants | Oceania | 54.6 /100 | #170 | Average 12.3% |
| Immigrants | Spain | 51.3 /100 | #171 | Average 12.3% |
| Immigrants | Portugal | 50.5 /100 | #172 | Average 12.3% |
| Celtics | 50.1 /100 | #173 | Average 12.3% |
| Lebanese | 50.0 /100 | #174 | Average 12.3% |
| South Americans | 48.7 /100 | #175 | Average 12.3% |
| Immigrants | Colombia | 47.7 /100 | #176 | Average 12.3% |
| Immigrants | Syria | 47.5 /100 | #177 | Average 12.3% |
| Uruguayans | 44.7 /100 | #178 | Average 12.4% |
| Immigrants | Morocco | 44.0 /100 | #179 | Average 12.4% |
| Mongolians | 43.6 /100 | #180 | Average 12.4% |
Demographics Similar to Immigrants from Germany by Poverty
In terms of poverty, the demographic groups most similar to Immigrants from Germany are Immigrants from Malaysia (12.0%, a difference of 0.0%), Immigrants from Kazakhstan (12.0%, a difference of 0.050%), Samoan (12.0%, a difference of 0.10%), Immigrants from Bosnia and Herzegovina (12.0%, a difference of 0.12%), and Afghan (12.0%, a difference of 0.28%).
| Demographics | Rating | Rank | Poverty |
| Immigrants | France | 80.5 /100 | #141 | Excellent 11.9% |
| Basques | 80.4 /100 | #142 | Excellent 11.9% |
| Brazilians | 79.7 /100 | #143 | Good 11.9% |
| Icelanders | 77.9 /100 | #144 | Good 11.9% |
| Syrians | 75.1 /100 | #145 | Good 12.0% |
| Afghans | 74.9 /100 | #146 | Good 12.0% |
| Immigrants | Bosnia and Herzegovina | 73.7 /100 | #147 | Good 12.0% |
| Immigrants | Germany | 72.7 /100 | #148 | Good 12.0% |
| Immigrants | Malaysia | 72.7 /100 | #149 | Good 12.0% |
| Immigrants | Kazakhstan | 72.3 /100 | #150 | Good 12.0% |
| Samoans | 71.9 /100 | #151 | Good 12.0% |
| Armenians | 67.6 /100 | #152 | Good 12.1% |
| Immigrants | Northern Africa | 63.9 /100 | #153 | Good 12.1% |
| Guamanians/Chamorros | 63.9 /100 | #154 | Good 12.1% |
| Hungarians | 63.6 /100 | #155 | Good 12.2% |