Immigrants from Yemen vs Japanese Female Poverty
COMPARE
Immigrants from Yemen
Japanese
Female Poverty
Female Poverty Comparison
Immigrants from Yemen
Japanese
22.8%
FEMALE POVERTY
0.0/ 100
METRIC RATING
342nd/ 347
METRIC RANK
14.5%
FEMALE POVERTY
4.1/ 100
METRIC RATING
219th/ 347
METRIC RANK
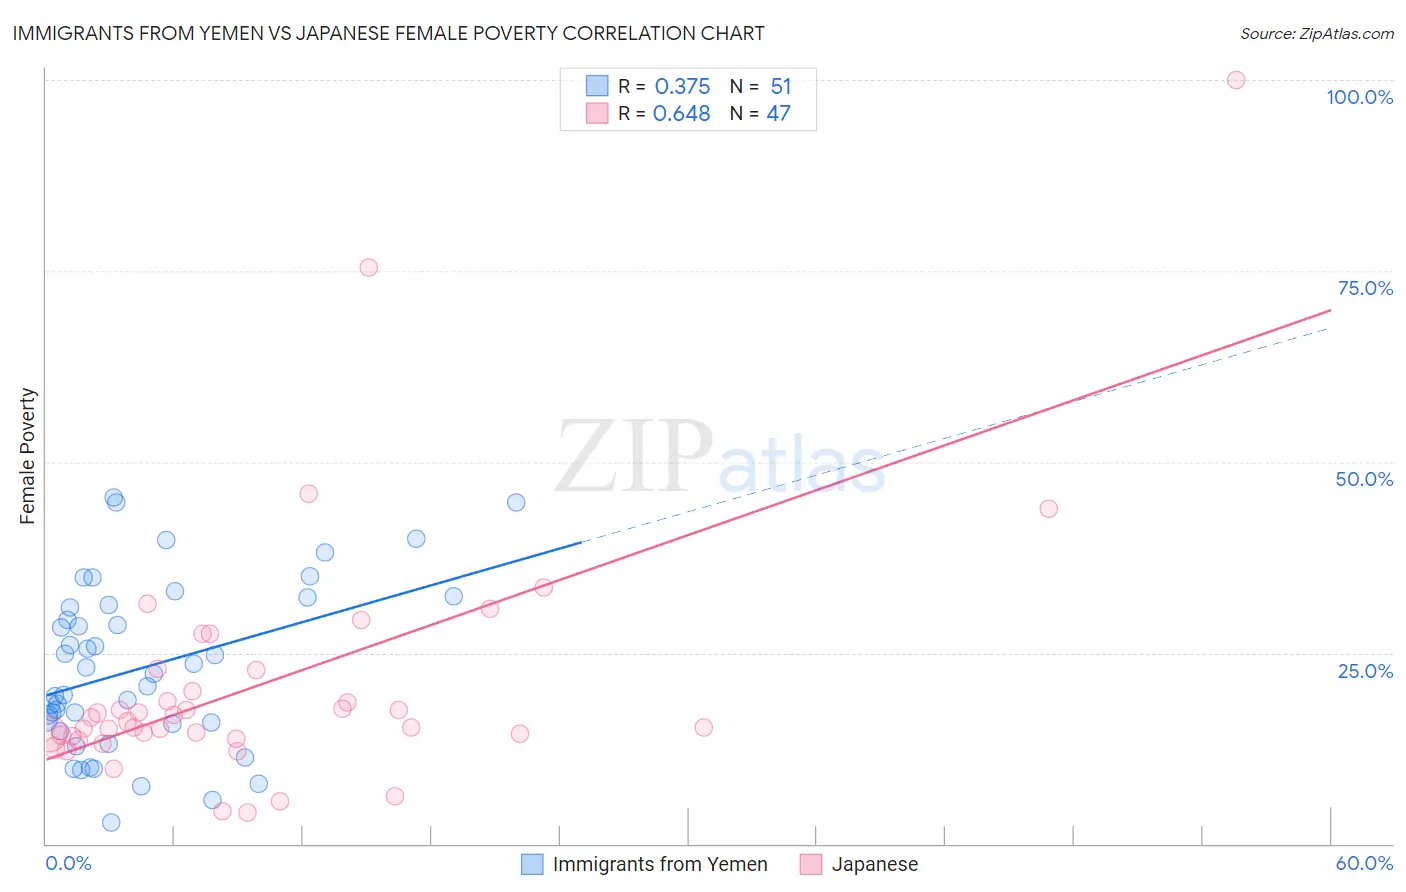
Immigrants from Yemen vs Japanese Female Poverty Correlation Chart
The statistical analysis conducted on geographies consisting of 82,433,611 people shows a mild positive correlation between the proportion of Immigrants from Yemen and poverty level among females in the United States with a correlation coefficient (R) of 0.375 and weighted average of 22.8%. Similarly, the statistical analysis conducted on geographies consisting of 249,060,032 people shows a significant positive correlation between the proportion of Japanese and poverty level among females in the United States with a correlation coefficient (R) of 0.648 and weighted average of 14.5%, a difference of 57.9%.
Female Poverty Correlation Summary
| Measurement | Immigrants from Yemen | Japanese |
| Minimum | 2.8% | 4.1% |
| Maximum | 45.4% | 100.0% |
| Range | 42.6% | 95.9% |
| Mean | 23.0% | 21.0% |
| Median | 22.3% | 16.0% |
| Interquartile 25% (IQ1) | 15.6% | 14.2% |
| Interquartile 75% (IQ3) | 31.2% | 22.7% |
| Interquartile Range (IQR) | 15.6% | 8.6% |
| Standard Deviation (Sample) | 10.9% | 16.8% |
| Standard Deviation (Population) | 10.7% | 16.7% |
Similar Demographics by Female Poverty
Demographics Similar to Immigrants from Yemen by Female Poverty
In terms of female poverty, the demographic groups most similar to Immigrants from Yemen are Lumbee (23.5%, a difference of 3.0%), Crow (22.1%, a difference of 3.2%), Pima (23.6%, a difference of 3.3%), Navajo (23.9%, a difference of 4.6%), and Yup'ik (21.5%, a difference of 6.3%).
| Demographics | Rating | Rank | Female Poverty |
| Immigrants | Dominican Republic | 0.0 /100 | #333 | Tragic 19.3% |
| Houma | 0.0 /100 | #334 | Tragic 20.0% |
| Cheyenne | 0.0 /100 | #335 | Tragic 20.2% |
| Pueblo | 0.0 /100 | #336 | Tragic 20.7% |
| Yuman | 0.0 /100 | #337 | Tragic 20.8% |
| Sioux | 0.0 /100 | #338 | Tragic 20.9% |
| Hopi | 0.0 /100 | #339 | Tragic 21.0% |
| Yup'ik | 0.0 /100 | #340 | Tragic 21.5% |
| Crow | 0.0 /100 | #341 | Tragic 22.1% |
| Immigrants | Yemen | 0.0 /100 | #342 | Tragic 22.8% |
| Lumbee | 0.0 /100 | #343 | Tragic 23.5% |
| Pima | 0.0 /100 | #344 | Tragic 23.6% |
| Navajo | 0.0 /100 | #345 | Tragic 23.9% |
| Puerto Ricans | 0.0 /100 | #346 | Tragic 25.2% |
| Tohono O'odham | 0.0 /100 | #347 | Tragic 25.9% |
Demographics Similar to Japanese by Female Poverty
In terms of female poverty, the demographic groups most similar to Japanese are Alsatian (14.5%, a difference of 0.050%), Immigrants from Uzbekistan (14.4%, a difference of 0.14%), Immigrants (14.4%, a difference of 0.19%), Immigrants from Thailand (14.4%, a difference of 0.22%), and Immigrants from Cambodia (14.5%, a difference of 0.24%).
| Demographics | Rating | Rank | Female Poverty |
| Bermudans | 5.5 /100 | #212 | Tragic 14.4% |
| Alaskan Athabascans | 5.3 /100 | #213 | Tragic 14.4% |
| Marshallese | 5.0 /100 | #214 | Tragic 14.4% |
| Immigrants | Panama | 4.7 /100 | #215 | Tragic 14.4% |
| Immigrants | Thailand | 4.5 /100 | #216 | Tragic 14.4% |
| Immigrants | Immigrants | 4.5 /100 | #217 | Tragic 14.4% |
| Immigrants | Uzbekistan | 4.4 /100 | #218 | Tragic 14.4% |
| Japanese | 4.1 /100 | #219 | Tragic 14.5% |
| Alsatians | 4.0 /100 | #220 | Tragic 14.5% |
| Immigrants | Cambodia | 3.7 /100 | #221 | Tragic 14.5% |
| Immigrants | Nonimmigrants | 3.7 /100 | #222 | Tragic 14.5% |
| Immigrants | Africa | 3.3 /100 | #223 | Tragic 14.5% |
| Americans | 2.8 /100 | #224 | Tragic 14.6% |
| Immigrants | Micronesia | 2.8 /100 | #225 | Tragic 14.6% |
| Immigrants | Eritrea | 2.4 /100 | #226 | Tragic 14.6% |