Immigrants from Yemen vs Immigrants from Eastern Asia Female Poverty
COMPARE
Immigrants from Yemen
Immigrants from Eastern Asia
Female Poverty
Female Poverty Comparison
Immigrants from Yemen
Immigrants from Eastern Asia
22.8%
FEMALE POVERTY
0.0/ 100
METRIC RATING
342nd/ 347
METRIC RANK
12.2%
FEMALE POVERTY
97.8/ 100
METRIC RATING
67th/ 347
METRIC RANK
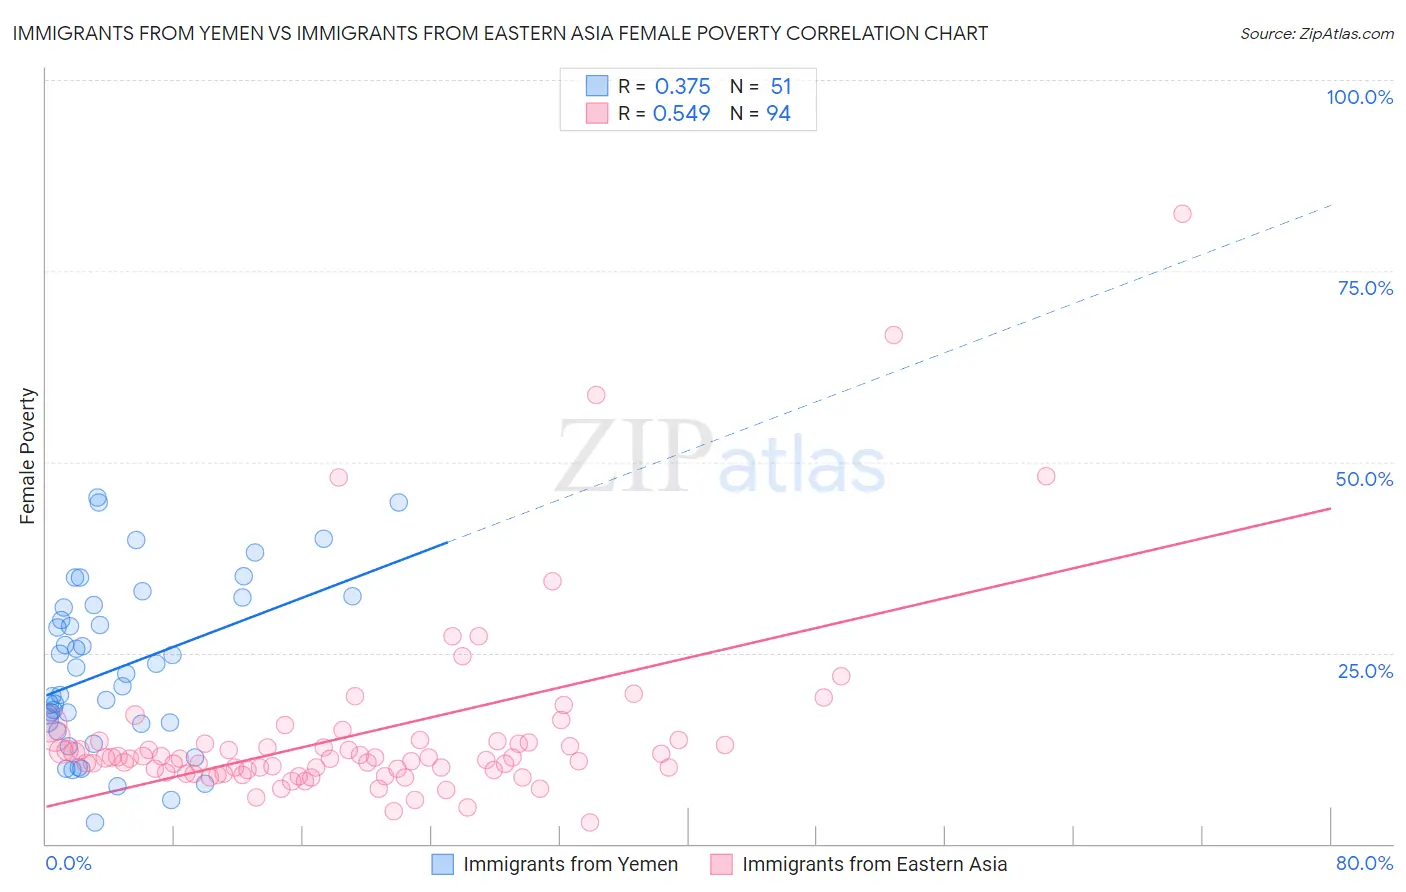
Immigrants from Yemen vs Immigrants from Eastern Asia Female Poverty Correlation Chart
The statistical analysis conducted on geographies consisting of 82,433,611 people shows a mild positive correlation between the proportion of Immigrants from Yemen and poverty level among females in the United States with a correlation coefficient (R) of 0.375 and weighted average of 22.8%. Similarly, the statistical analysis conducted on geographies consisting of 499,182,216 people shows a substantial positive correlation between the proportion of Immigrants from Eastern Asia and poverty level among females in the United States with a correlation coefficient (R) of 0.549 and weighted average of 12.2%, a difference of 87.0%.
Female Poverty Correlation Summary
| Measurement | Immigrants from Yemen | Immigrants from Eastern Asia |
| Minimum | 2.8% | 2.9% |
| Maximum | 45.4% | 82.5% |
| Range | 42.6% | 79.7% |
| Mean | 23.0% | 14.5% |
| Median | 22.3% | 11.3% |
| Interquartile 25% (IQ1) | 15.6% | 9.7% |
| Interquartile 75% (IQ3) | 31.2% | 13.5% |
| Interquartile Range (IQR) | 15.6% | 3.8% |
| Standard Deviation (Sample) | 10.9% | 12.4% |
| Standard Deviation (Population) | 10.7% | 12.3% |
Similar Demographics by Female Poverty
Demographics Similar to Immigrants from Yemen by Female Poverty
In terms of female poverty, the demographic groups most similar to Immigrants from Yemen are Lumbee (23.5%, a difference of 3.0%), Crow (22.1%, a difference of 3.2%), Pima (23.6%, a difference of 3.3%), Navajo (23.9%, a difference of 4.6%), and Yup'ik (21.5%, a difference of 6.3%).
| Demographics | Rating | Rank | Female Poverty |
| Immigrants | Dominican Republic | 0.0 /100 | #333 | Tragic 19.3% |
| Houma | 0.0 /100 | #334 | Tragic 20.0% |
| Cheyenne | 0.0 /100 | #335 | Tragic 20.2% |
| Pueblo | 0.0 /100 | #336 | Tragic 20.7% |
| Yuman | 0.0 /100 | #337 | Tragic 20.8% |
| Sioux | 0.0 /100 | #338 | Tragic 20.9% |
| Hopi | 0.0 /100 | #339 | Tragic 21.0% |
| Yup'ik | 0.0 /100 | #340 | Tragic 21.5% |
| Crow | 0.0 /100 | #341 | Tragic 22.1% |
| Immigrants | Yemen | 0.0 /100 | #342 | Tragic 22.8% |
| Lumbee | 0.0 /100 | #343 | Tragic 23.5% |
| Pima | 0.0 /100 | #344 | Tragic 23.6% |
| Navajo | 0.0 /100 | #345 | Tragic 23.9% |
| Puerto Ricans | 0.0 /100 | #346 | Tragic 25.2% |
| Tohono O'odham | 0.0 /100 | #347 | Tragic 25.9% |
Demographics Similar to Immigrants from Eastern Asia by Female Poverty
In terms of female poverty, the demographic groups most similar to Immigrants from Eastern Asia are Immigrants from Netherlands (12.2%, a difference of 0.040%), Austrian (12.2%, a difference of 0.13%), Indian (Asian) (12.2%, a difference of 0.14%), Swiss (12.2%, a difference of 0.14%), and German (12.2%, a difference of 0.17%).
| Demographics | Rating | Rank | Female Poverty |
| Immigrants | Australia | 98.1 /100 | #60 | Exceptional 12.2% |
| Immigrants | Asia | 98.1 /100 | #61 | Exceptional 12.2% |
| Immigrants | Italy | 98.0 /100 | #62 | Exceptional 12.2% |
| Ukrainians | 98.0 /100 | #63 | Exceptional 12.2% |
| Germans | 98.0 /100 | #64 | Exceptional 12.2% |
| Indians (Asian) | 97.9 /100 | #65 | Exceptional 12.2% |
| Austrians | 97.9 /100 | #66 | Exceptional 12.2% |
| Immigrants | Eastern Asia | 97.8 /100 | #67 | Exceptional 12.2% |
| Immigrants | Netherlands | 97.8 /100 | #68 | Exceptional 12.2% |
| Swiss | 97.7 /100 | #69 | Exceptional 12.2% |
| Immigrants | Belgium | 97.7 /100 | #70 | Exceptional 12.2% |
| Carpatho Rusyns | 97.6 /100 | #71 | Exceptional 12.2% |
| Cambodians | 97.5 /100 | #72 | Exceptional 12.2% |
| Zimbabweans | 97.5 /100 | #73 | Exceptional 12.3% |
| Immigrants | Canada | 97.5 /100 | #74 | Exceptional 12.3% |