Bolivian vs Japanese Female Poverty
COMPARE
Bolivian
Japanese
Female Poverty
Female Poverty Comparison
Bolivians
Japanese
11.5%
FEMALE POVERTY
99.8/ 100
METRIC RATING
17th/ 347
METRIC RANK
14.5%
FEMALE POVERTY
4.1/ 100
METRIC RATING
219th/ 347
METRIC RANK
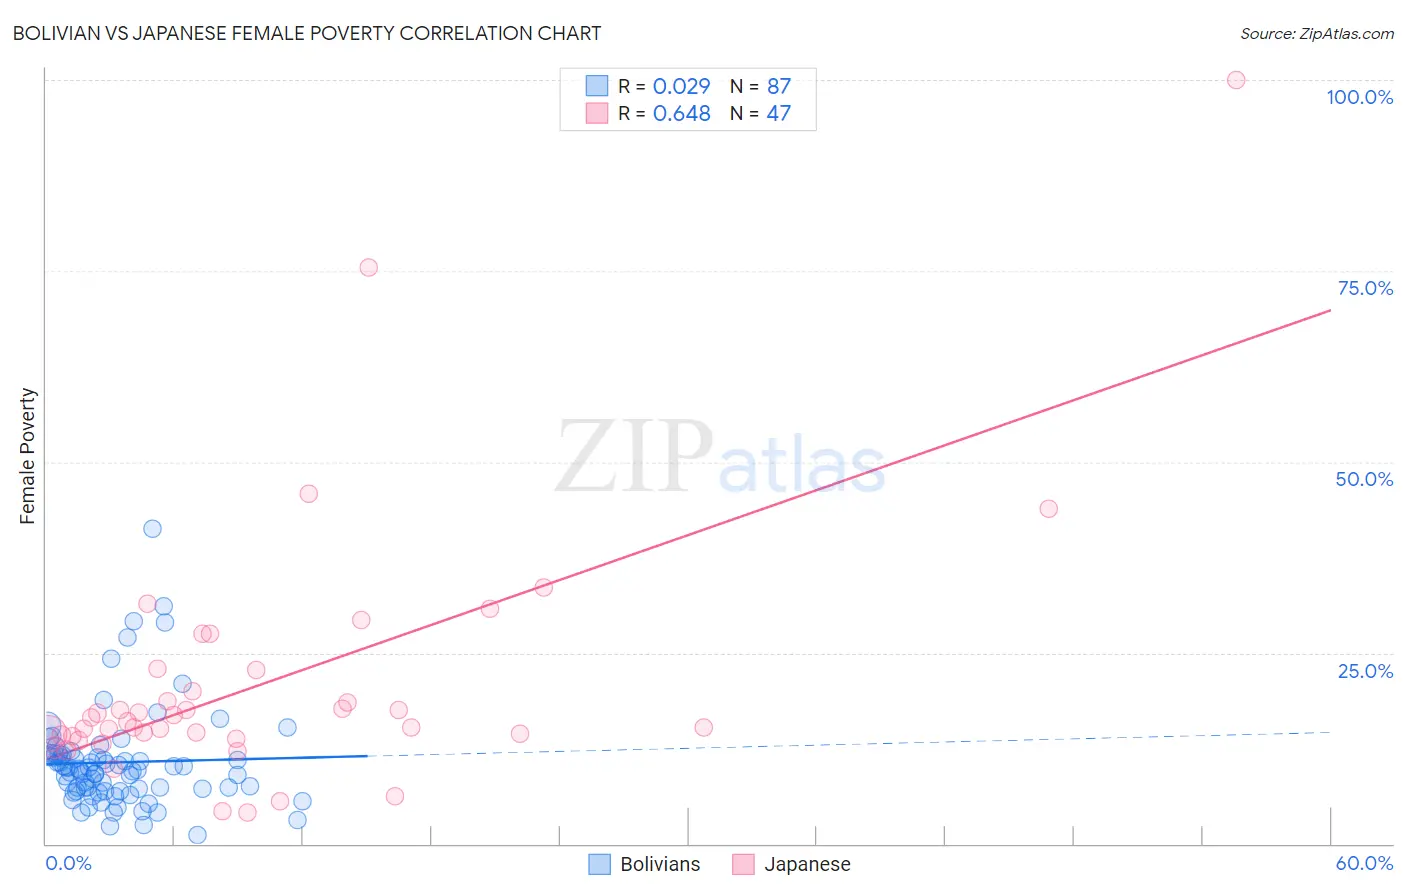
Bolivian vs Japanese Female Poverty Correlation Chart
The statistical analysis conducted on geographies consisting of 184,615,505 people shows no correlation between the proportion of Bolivians and poverty level among females in the United States with a correlation coefficient (R) of 0.029 and weighted average of 11.5%. Similarly, the statistical analysis conducted on geographies consisting of 249,060,032 people shows a significant positive correlation between the proportion of Japanese and poverty level among females in the United States with a correlation coefficient (R) of 0.648 and weighted average of 14.5%, a difference of 25.8%.
Female Poverty Correlation Summary
| Measurement | Bolivian | Japanese |
| Minimum | 1.1% | 4.1% |
| Maximum | 41.2% | 100.0% |
| Range | 40.1% | 95.9% |
| Mean | 10.7% | 21.0% |
| Median | 9.7% | 16.0% |
| Interquartile 25% (IQ1) | 6.9% | 14.2% |
| Interquartile 75% (IQ3) | 11.6% | 22.7% |
| Interquartile Range (IQR) | 4.7% | 8.6% |
| Standard Deviation (Sample) | 6.6% | 16.8% |
| Standard Deviation (Population) | 6.5% | 16.7% |
Similar Demographics by Female Poverty
Demographics Similar to Bolivians by Female Poverty
In terms of female poverty, the demographic groups most similar to Bolivians are Immigrants from Scotland (11.5%, a difference of 0.050%), Immigrants from Bolivia (11.5%, a difference of 0.070%), Norwegian (11.5%, a difference of 0.090%), Eastern European (11.5%, a difference of 0.32%), and Latvian (11.4%, a difference of 0.54%).
| Demographics | Rating | Rank | Female Poverty |
| Immigrants | Hong Kong | 99.9 /100 | #10 | Exceptional 11.2% |
| Maltese | 99.9 /100 | #11 | Exceptional 11.2% |
| Bhutanese | 99.9 /100 | #12 | Exceptional 11.3% |
| Immigrants | Lithuania | 99.9 /100 | #13 | Exceptional 11.3% |
| Lithuanians | 99.8 /100 | #14 | Exceptional 11.4% |
| Latvians | 99.8 /100 | #15 | Exceptional 11.4% |
| Immigrants | Bolivia | 99.8 /100 | #16 | Exceptional 11.5% |
| Bolivians | 99.8 /100 | #17 | Exceptional 11.5% |
| Immigrants | Scotland | 99.8 /100 | #18 | Exceptional 11.5% |
| Norwegians | 99.8 /100 | #19 | Exceptional 11.5% |
| Eastern Europeans | 99.7 /100 | #20 | Exceptional 11.5% |
| Italians | 99.7 /100 | #21 | Exceptional 11.6% |
| Swedes | 99.7 /100 | #22 | Exceptional 11.6% |
| Burmese | 99.7 /100 | #23 | Exceptional 11.6% |
| Luxembourgers | 99.7 /100 | #24 | Exceptional 11.6% |
Demographics Similar to Japanese by Female Poverty
In terms of female poverty, the demographic groups most similar to Japanese are Alsatian (14.5%, a difference of 0.050%), Immigrants from Uzbekistan (14.4%, a difference of 0.14%), Immigrants (14.4%, a difference of 0.19%), Immigrants from Thailand (14.4%, a difference of 0.22%), and Immigrants from Cambodia (14.5%, a difference of 0.24%).
| Demographics | Rating | Rank | Female Poverty |
| Bermudans | 5.5 /100 | #212 | Tragic 14.4% |
| Alaskan Athabascans | 5.3 /100 | #213 | Tragic 14.4% |
| Marshallese | 5.0 /100 | #214 | Tragic 14.4% |
| Immigrants | Panama | 4.7 /100 | #215 | Tragic 14.4% |
| Immigrants | Thailand | 4.5 /100 | #216 | Tragic 14.4% |
| Immigrants | Immigrants | 4.5 /100 | #217 | Tragic 14.4% |
| Immigrants | Uzbekistan | 4.4 /100 | #218 | Tragic 14.4% |
| Japanese | 4.1 /100 | #219 | Tragic 14.5% |
| Alsatians | 4.0 /100 | #220 | Tragic 14.5% |
| Immigrants | Cambodia | 3.7 /100 | #221 | Tragic 14.5% |
| Immigrants | Nonimmigrants | 3.7 /100 | #222 | Tragic 14.5% |
| Immigrants | Africa | 3.3 /100 | #223 | Tragic 14.5% |
| Americans | 2.8 /100 | #224 | Tragic 14.6% |
| Immigrants | Micronesia | 2.8 /100 | #225 | Tragic 14.6% |
| Immigrants | Eritrea | 2.4 /100 | #226 | Tragic 14.6% |