Immigrants from Yemen vs Immigrants from Western Asia Female Poverty
COMPARE
Immigrants from Yemen
Immigrants from Western Asia
Female Poverty
Female Poverty Comparison
Immigrants from Yemen
Immigrants from Western Asia
22.8%
FEMALE POVERTY
0.0/ 100
METRIC RATING
342nd/ 347
METRIC RANK
13.9%
FEMALE POVERTY
20.7/ 100
METRIC RATING
203rd/ 347
METRIC RANK
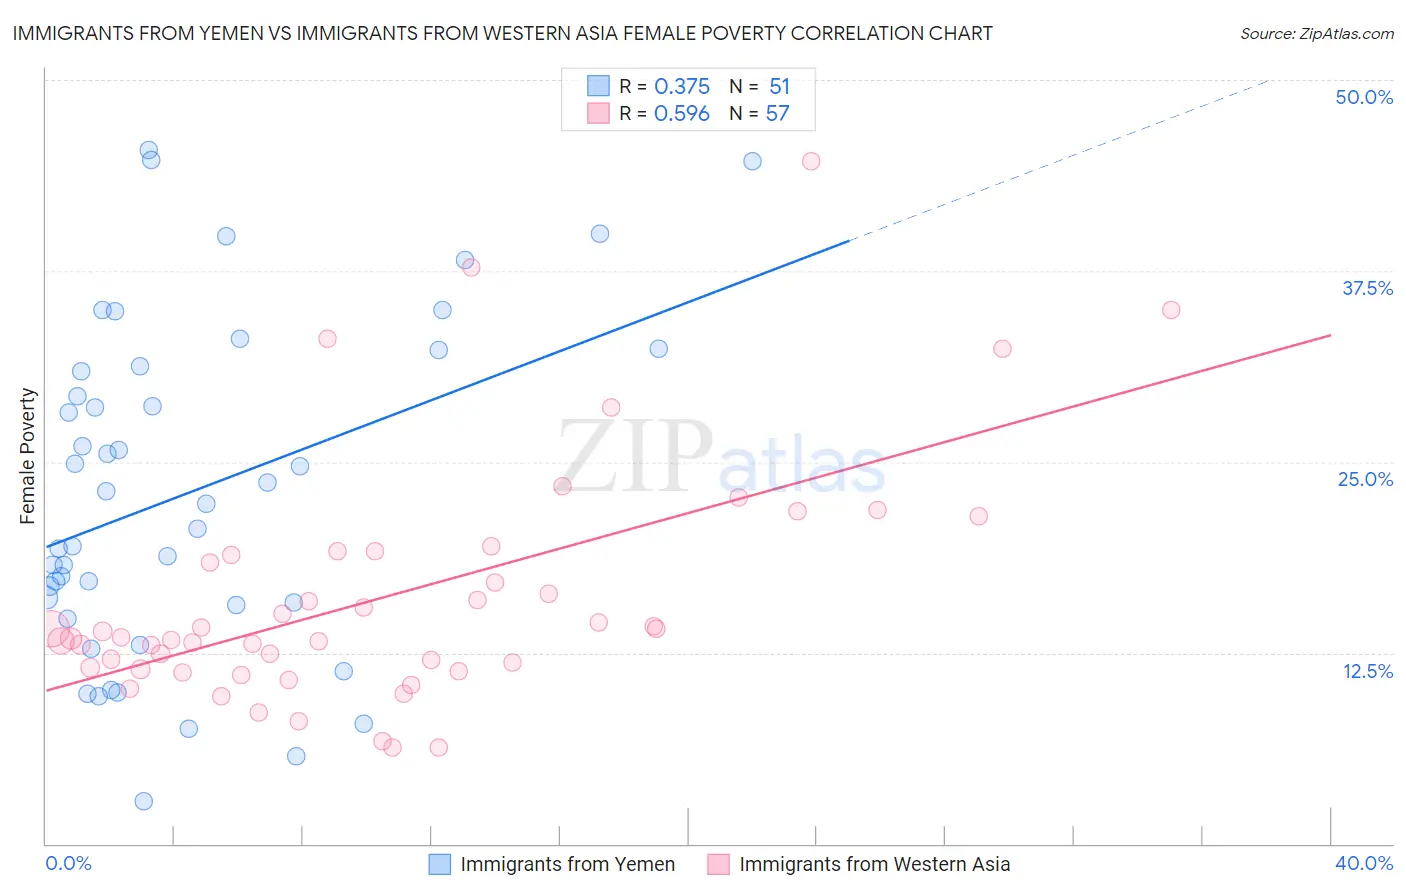
Immigrants from Yemen vs Immigrants from Western Asia Female Poverty Correlation Chart
The statistical analysis conducted on geographies consisting of 82,433,611 people shows a mild positive correlation between the proportion of Immigrants from Yemen and poverty level among females in the United States with a correlation coefficient (R) of 0.375 and weighted average of 22.8%. Similarly, the statistical analysis conducted on geographies consisting of 404,121,163 people shows a substantial positive correlation between the proportion of Immigrants from Western Asia and poverty level among females in the United States with a correlation coefficient (R) of 0.596 and weighted average of 13.9%, a difference of 64.6%.
Female Poverty Correlation Summary
| Measurement | Immigrants from Yemen | Immigrants from Western Asia |
| Minimum | 2.8% | 6.3% |
| Maximum | 45.4% | 44.7% |
| Range | 42.6% | 38.4% |
| Mean | 23.0% | 16.2% |
| Median | 22.3% | 13.5% |
| Interquartile 25% (IQ1) | 15.6% | 11.5% |
| Interquartile 75% (IQ3) | 31.2% | 19.0% |
| Interquartile Range (IQR) | 15.6% | 7.6% |
| Standard Deviation (Sample) | 10.9% | 7.8% |
| Standard Deviation (Population) | 10.7% | 7.8% |
Similar Demographics by Female Poverty
Demographics Similar to Immigrants from Yemen by Female Poverty
In terms of female poverty, the demographic groups most similar to Immigrants from Yemen are Lumbee (23.5%, a difference of 3.0%), Crow (22.1%, a difference of 3.2%), Pima (23.6%, a difference of 3.3%), Navajo (23.9%, a difference of 4.6%), and Yup'ik (21.5%, a difference of 6.3%).
| Demographics | Rating | Rank | Female Poverty |
| Immigrants | Dominican Republic | 0.0 /100 | #333 | Tragic 19.3% |
| Houma | 0.0 /100 | #334 | Tragic 20.0% |
| Cheyenne | 0.0 /100 | #335 | Tragic 20.2% |
| Pueblo | 0.0 /100 | #336 | Tragic 20.7% |
| Yuman | 0.0 /100 | #337 | Tragic 20.8% |
| Sioux | 0.0 /100 | #338 | Tragic 20.9% |
| Hopi | 0.0 /100 | #339 | Tragic 21.0% |
| Yup'ik | 0.0 /100 | #340 | Tragic 21.5% |
| Crow | 0.0 /100 | #341 | Tragic 22.1% |
| Immigrants | Yemen | 0.0 /100 | #342 | Tragic 22.8% |
| Lumbee | 0.0 /100 | #343 | Tragic 23.5% |
| Pima | 0.0 /100 | #344 | Tragic 23.6% |
| Navajo | 0.0 /100 | #345 | Tragic 23.9% |
| Puerto Ricans | 0.0 /100 | #346 | Tragic 25.2% |
| Tohono O'odham | 0.0 /100 | #347 | Tragic 25.9% |
Demographics Similar to Immigrants from Western Asia by Female Poverty
In terms of female poverty, the demographic groups most similar to Immigrants from Western Asia are Hmong (13.9%, a difference of 0.050%), Immigrants from Kenya (13.9%, a difference of 0.060%), Spanish (13.9%, a difference of 0.10%), Spaniard (13.9%, a difference of 0.27%), and Immigrants from Lebanon (13.8%, a difference of 0.65%).
| Demographics | Rating | Rank | Female Poverty |
| South American Indians | 28.9 /100 | #196 | Fair 13.7% |
| Arabs | 28.6 /100 | #197 | Fair 13.7% |
| Immigrants | Uganda | 28.5 /100 | #198 | Fair 13.7% |
| Immigrants | Lebanon | 25.6 /100 | #199 | Fair 13.8% |
| Spanish | 21.4 /100 | #200 | Fair 13.9% |
| Immigrants | Kenya | 21.1 /100 | #201 | Fair 13.9% |
| Hmong | 21.1 /100 | #202 | Fair 13.9% |
| Immigrants | Western Asia | 20.7 /100 | #203 | Fair 13.9% |
| Spaniards | 18.9 /100 | #204 | Poor 13.9% |
| Ugandans | 15.4 /100 | #205 | Poor 14.0% |
| Immigrants | Uruguay | 14.0 /100 | #206 | Poor 14.0% |
| Immigrants | Eastern Africa | 9.0 /100 | #207 | Tragic 14.2% |
| Immigrants | Azores | 7.9 /100 | #208 | Tragic 14.2% |
| Panamanians | 7.7 /100 | #209 | Tragic 14.2% |
| Malaysians | 7.4 /100 | #210 | Tragic 14.3% |