Immigrants from Russia vs Japanese Female Poverty
COMPARE
Immigrants from Russia
Japanese
Female Poverty
Female Poverty Comparison
Immigrants from Russia
Japanese
12.7%
FEMALE POVERTY
91.2/ 100
METRIC RATING
116th/ 347
METRIC RANK
14.5%
FEMALE POVERTY
4.1/ 100
METRIC RATING
219th/ 347
METRIC RANK
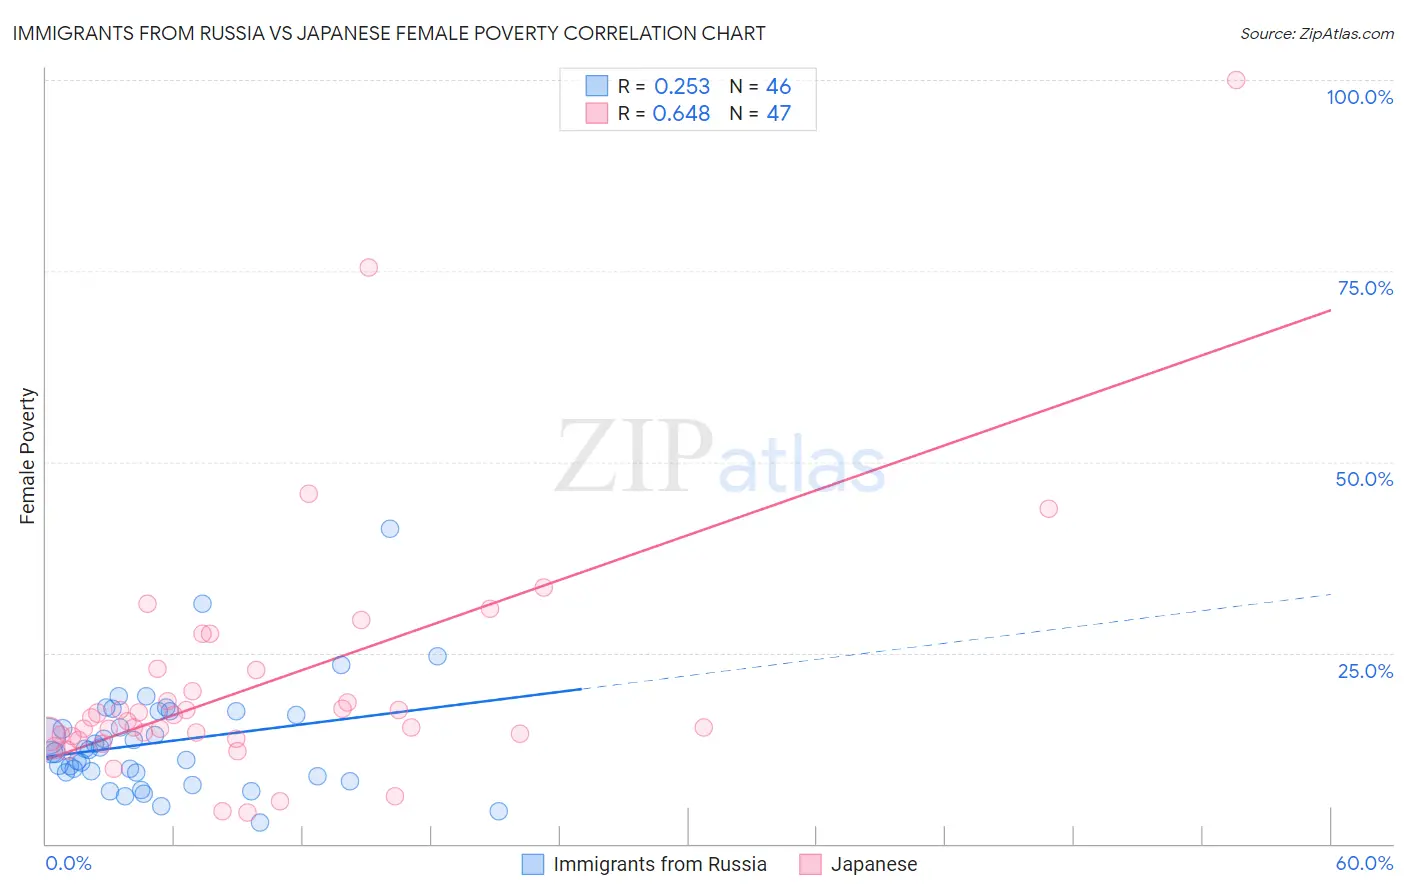
Immigrants from Russia vs Japanese Female Poverty Correlation Chart
The statistical analysis conducted on geographies consisting of 347,656,747 people shows a weak positive correlation between the proportion of Immigrants from Russia and poverty level among females in the United States with a correlation coefficient (R) of 0.253 and weighted average of 12.7%. Similarly, the statistical analysis conducted on geographies consisting of 249,060,032 people shows a significant positive correlation between the proportion of Japanese and poverty level among females in the United States with a correlation coefficient (R) of 0.648 and weighted average of 14.5%, a difference of 14.0%.
Female Poverty Correlation Summary
| Measurement | Immigrants from Russia | Japanese |
| Minimum | 2.9% | 4.1% |
| Maximum | 41.3% | 100.0% |
| Range | 38.4% | 95.9% |
| Mean | 13.3% | 21.0% |
| Median | 12.1% | 16.0% |
| Interquartile 25% (IQ1) | 9.4% | 14.2% |
| Interquartile 75% (IQ3) | 17.4% | 22.7% |
| Interquartile Range (IQR) | 8.0% | 8.6% |
| Standard Deviation (Sample) | 7.0% | 16.8% |
| Standard Deviation (Population) | 6.9% | 16.7% |
Similar Demographics by Female Poverty
Demographics Similar to Immigrants from Russia by Female Poverty
In terms of female poverty, the demographic groups most similar to Immigrants from Russia are Immigrants from Southern Europe (12.7%, a difference of 0.070%), Sri Lankan (12.7%, a difference of 0.090%), Albanian (12.7%, a difference of 0.10%), Puget Sound Salish (12.7%, a difference of 0.12%), and Welsh (12.7%, a difference of 0.14%).
| Demographics | Rating | Rank | Female Poverty |
| Immigrants | Zimbabwe | 93.1 /100 | #109 | Exceptional 12.6% |
| Paraguayans | 93.0 /100 | #110 | Exceptional 12.6% |
| Soviet Union | 92.4 /100 | #111 | Exceptional 12.6% |
| Immigrants | Israel | 92.0 /100 | #112 | Exceptional 12.6% |
| Canadians | 92.0 /100 | #113 | Exceptional 12.7% |
| Welsh | 91.6 /100 | #114 | Exceptional 12.7% |
| Puget Sound Salish | 91.5 /100 | #115 | Exceptional 12.7% |
| Immigrants | Russia | 91.2 /100 | #116 | Exceptional 12.7% |
| Immigrants | Southern Europe | 90.9 /100 | #117 | Exceptional 12.7% |
| Sri Lankans | 90.9 /100 | #118 | Exceptional 12.7% |
| Albanians | 90.8 /100 | #119 | Exceptional 12.7% |
| New Zealanders | 90.6 /100 | #120 | Exceptional 12.7% |
| Immigrants | Hungary | 90.3 /100 | #121 | Exceptional 12.7% |
| French Canadians | 90.2 /100 | #122 | Exceptional 12.7% |
| Immigrants | South Eastern Asia | 89.9 /100 | #123 | Excellent 12.7% |
Demographics Similar to Japanese by Female Poverty
In terms of female poverty, the demographic groups most similar to Japanese are Alsatian (14.5%, a difference of 0.050%), Immigrants from Uzbekistan (14.4%, a difference of 0.14%), Immigrants (14.4%, a difference of 0.19%), Immigrants from Thailand (14.4%, a difference of 0.22%), and Immigrants from Cambodia (14.5%, a difference of 0.24%).
| Demographics | Rating | Rank | Female Poverty |
| Bermudans | 5.5 /100 | #212 | Tragic 14.4% |
| Alaskan Athabascans | 5.3 /100 | #213 | Tragic 14.4% |
| Marshallese | 5.0 /100 | #214 | Tragic 14.4% |
| Immigrants | Panama | 4.7 /100 | #215 | Tragic 14.4% |
| Immigrants | Thailand | 4.5 /100 | #216 | Tragic 14.4% |
| Immigrants | Immigrants | 4.5 /100 | #217 | Tragic 14.4% |
| Immigrants | Uzbekistan | 4.4 /100 | #218 | Tragic 14.4% |
| Japanese | 4.1 /100 | #219 | Tragic 14.5% |
| Alsatians | 4.0 /100 | #220 | Tragic 14.5% |
| Immigrants | Cambodia | 3.7 /100 | #221 | Tragic 14.5% |
| Immigrants | Nonimmigrants | 3.7 /100 | #222 | Tragic 14.5% |
| Immigrants | Africa | 3.3 /100 | #223 | Tragic 14.5% |
| Americans | 2.8 /100 | #224 | Tragic 14.6% |
| Immigrants | Micronesia | 2.8 /100 | #225 | Tragic 14.6% |
| Immigrants | Eritrea | 2.4 /100 | #226 | Tragic 14.6% |