Cypriot vs Immigrants from Western Asia Female Poverty
COMPARE
Cypriot
Immigrants from Western Asia
Female Poverty
Female Poverty Comparison
Cypriots
Immigrants from Western Asia
11.8%
FEMALE POVERTY
99.5/ 100
METRIC RATING
33rd/ 347
METRIC RANK
13.9%
FEMALE POVERTY
20.7/ 100
METRIC RATING
203rd/ 347
METRIC RANK
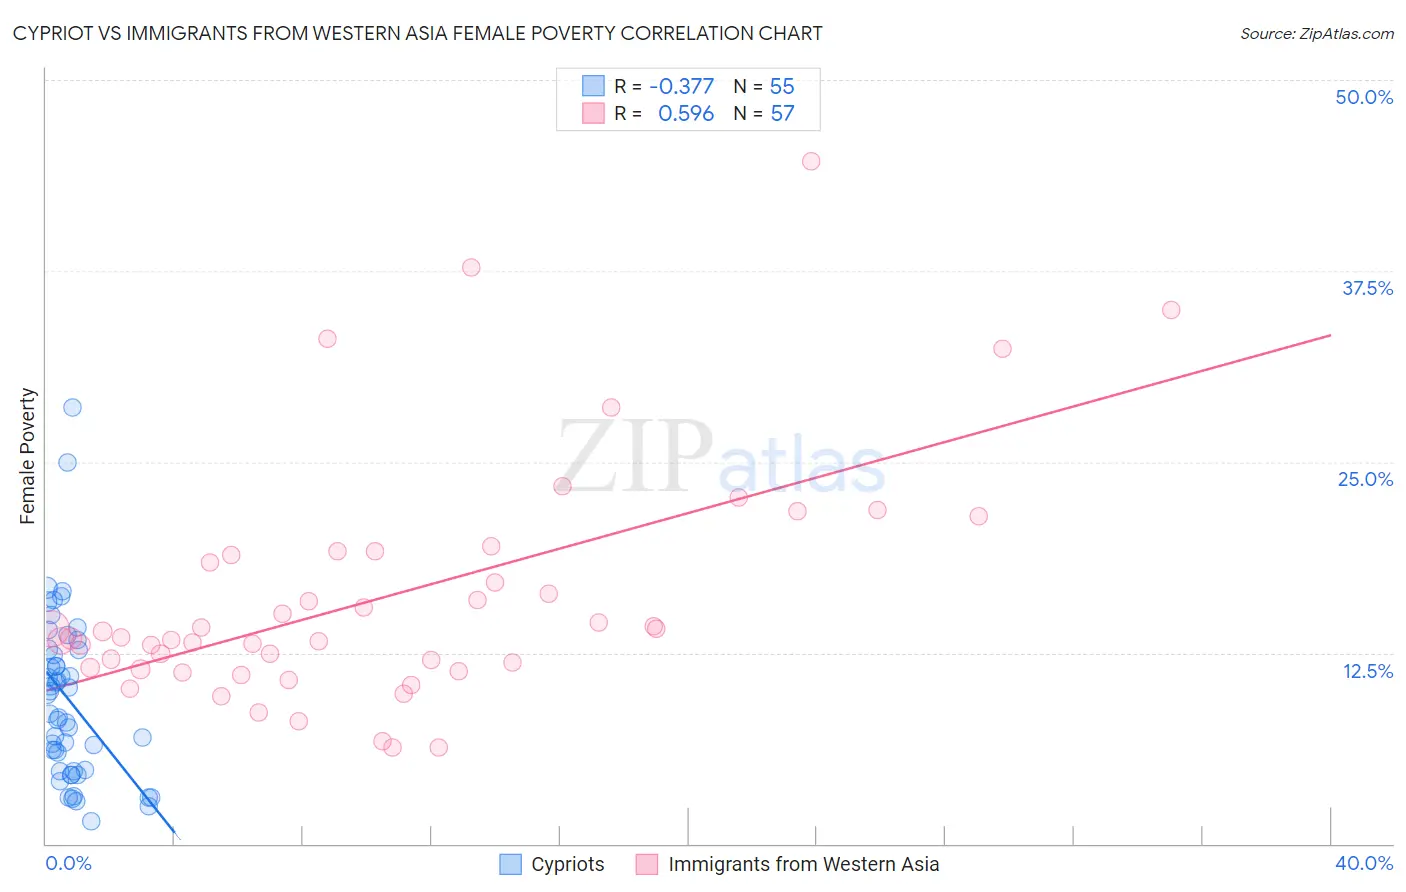
Cypriot vs Immigrants from Western Asia Female Poverty Correlation Chart
The statistical analysis conducted on geographies consisting of 61,838,205 people shows a mild negative correlation between the proportion of Cypriots and poverty level among females in the United States with a correlation coefficient (R) of -0.377 and weighted average of 11.8%. Similarly, the statistical analysis conducted on geographies consisting of 404,121,163 people shows a substantial positive correlation between the proportion of Immigrants from Western Asia and poverty level among females in the United States with a correlation coefficient (R) of 0.596 and weighted average of 13.9%, a difference of 18.1%.
Female Poverty Correlation Summary
| Measurement | Cypriot | Immigrants from Western Asia |
| Minimum | 1.5% | 6.3% |
| Maximum | 28.6% | 44.7% |
| Range | 27.1% | 38.4% |
| Mean | 9.4% | 16.2% |
| Median | 8.5% | 13.5% |
| Interquartile 25% (IQ1) | 4.7% | 11.5% |
| Interquartile 75% (IQ3) | 12.6% | 19.0% |
| Interquartile Range (IQR) | 7.9% | 7.6% |
| Standard Deviation (Sample) | 5.5% | 7.8% |
| Standard Deviation (Population) | 5.4% | 7.8% |
Similar Demographics by Female Poverty
Demographics Similar to Cypriots by Female Poverty
In terms of female poverty, the demographic groups most similar to Cypriots are Danish (11.7%, a difference of 0.070%), Immigrants from Singapore (11.8%, a difference of 0.12%), Polish (11.7%, a difference of 0.21%), Immigrants from Iran (11.8%, a difference of 0.29%), and Greek (11.7%, a difference of 0.42%).
| Demographics | Rating | Rank | Female Poverty |
| Croatians | 99.6 /100 | #26 | Exceptional 11.6% |
| Iranians | 99.6 /100 | #27 | Exceptional 11.7% |
| Immigrants | Korea | 99.6 /100 | #28 | Exceptional 11.7% |
| Immigrants | North Macedonia | 99.6 /100 | #29 | Exceptional 11.7% |
| Greeks | 99.5 /100 | #30 | Exceptional 11.7% |
| Poles | 99.5 /100 | #31 | Exceptional 11.7% |
| Danes | 99.5 /100 | #32 | Exceptional 11.7% |
| Cypriots | 99.5 /100 | #33 | Exceptional 11.8% |
| Immigrants | Singapore | 99.4 /100 | #34 | Exceptional 11.8% |
| Immigrants | Iran | 99.4 /100 | #35 | Exceptional 11.8% |
| Immigrants | Pakistan | 99.4 /100 | #36 | Exceptional 11.8% |
| Immigrants | Greece | 99.3 /100 | #37 | Exceptional 11.8% |
| Russians | 99.3 /100 | #38 | Exceptional 11.8% |
| Immigrants | Poland | 99.3 /100 | #39 | Exceptional 11.8% |
| Macedonians | 99.3 /100 | #40 | Exceptional 11.8% |
Demographics Similar to Immigrants from Western Asia by Female Poverty
In terms of female poverty, the demographic groups most similar to Immigrants from Western Asia are Hmong (13.9%, a difference of 0.050%), Immigrants from Kenya (13.9%, a difference of 0.060%), Spanish (13.9%, a difference of 0.10%), Spaniard (13.9%, a difference of 0.27%), and Immigrants from Lebanon (13.8%, a difference of 0.65%).
| Demographics | Rating | Rank | Female Poverty |
| South American Indians | 28.9 /100 | #196 | Fair 13.7% |
| Arabs | 28.6 /100 | #197 | Fair 13.7% |
| Immigrants | Uganda | 28.5 /100 | #198 | Fair 13.7% |
| Immigrants | Lebanon | 25.6 /100 | #199 | Fair 13.8% |
| Spanish | 21.4 /100 | #200 | Fair 13.9% |
| Immigrants | Kenya | 21.1 /100 | #201 | Fair 13.9% |
| Hmong | 21.1 /100 | #202 | Fair 13.9% |
| Immigrants | Western Asia | 20.7 /100 | #203 | Fair 13.9% |
| Spaniards | 18.9 /100 | #204 | Poor 13.9% |
| Ugandans | 15.4 /100 | #205 | Poor 14.0% |
| Immigrants | Uruguay | 14.0 /100 | #206 | Poor 14.0% |
| Immigrants | Eastern Africa | 9.0 /100 | #207 | Tragic 14.2% |
| Immigrants | Azores | 7.9 /100 | #208 | Tragic 14.2% |
| Panamanians | 7.7 /100 | #209 | Tragic 14.2% |
| Malaysians | 7.4 /100 | #210 | Tragic 14.3% |