Immigrants from Yemen vs Immigrants from Western Asia Unemployment Among Seniors over 75 years
COMPARE
Immigrants from Yemen
Immigrants from Western Asia
Unemployment Among Seniors over 75 years
Unemployment Among Seniors over 75 years Comparison
Immigrants from Yemen
Immigrants from Western Asia
16.5%
UNEMPLOYMENT AMONG SENIORS OVER 75 YEARS
0.0/ 100
METRIC RATING
344th/ 347
METRIC RANK
9.0%
UNEMPLOYMENT AMONG SENIORS OVER 75 YEARS
12.5/ 100
METRIC RATING
215th/ 347
METRIC RANK
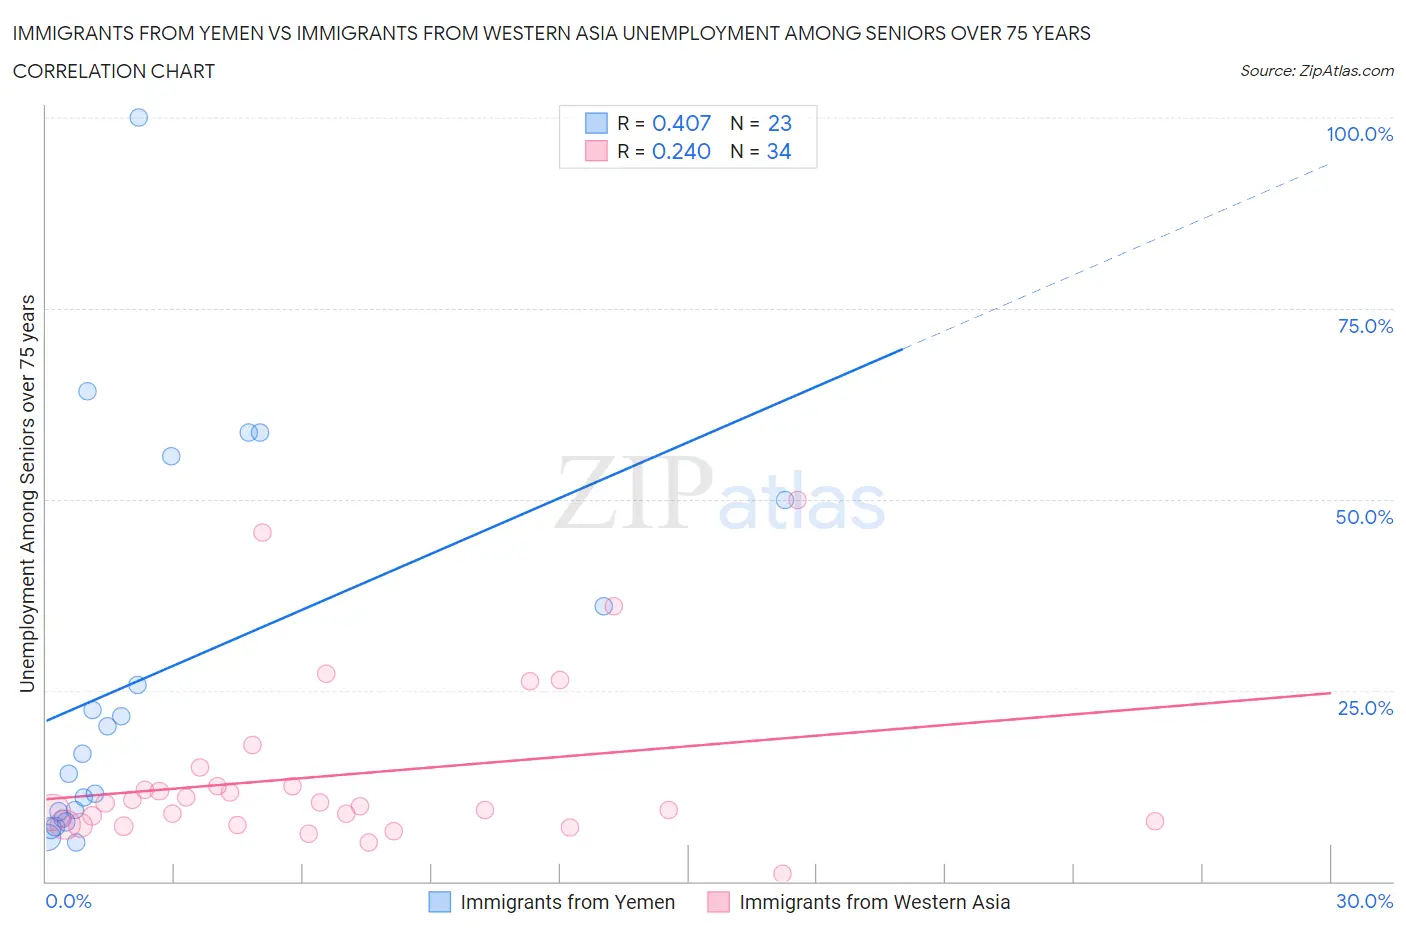
Immigrants from Yemen vs Immigrants from Western Asia Unemployment Among Seniors over 75 years Correlation Chart
The statistical analysis conducted on geographies consisting of 63,934,769 people shows a moderate positive correlation between the proportion of Immigrants from Yemen and unemployment rate among seniors over the age of 75 in the United States with a correlation coefficient (R) of 0.407 and weighted average of 16.5%. Similarly, the statistical analysis conducted on geographies consisting of 206,828,449 people shows a weak positive correlation between the proportion of Immigrants from Western Asia and unemployment rate among seniors over the age of 75 in the United States with a correlation coefficient (R) of 0.240 and weighted average of 9.0%, a difference of 83.7%.
Unemployment Among Seniors over 75 years Correlation Summary
| Measurement | Immigrants from Yemen | Immigrants from Western Asia |
| Minimum | 5.1% | 1.0% |
| Maximum | 100.0% | 50.0% |
| Range | 94.9% | 49.0% |
| Mean | 27.2% | 13.9% |
| Median | 16.7% | 10.0% |
| Interquartile 25% (IQ1) | 8.2% | 7.4% |
| Interquartile 75% (IQ3) | 50.0% | 12.5% |
| Interquartile Range (IQR) | 41.8% | 5.0% |
| Standard Deviation (Sample) | 25.3% | 11.2% |
| Standard Deviation (Population) | 24.8% | 11.0% |
Similar Demographics by Unemployment Among Seniors over 75 years
Demographics Similar to Immigrants from Yemen by Unemployment Among Seniors over 75 years
In terms of unemployment among seniors over 75 years, the demographic groups most similar to Immigrants from Yemen are Yakama (18.4%, a difference of 11.7%), Alaska Native (14.7%, a difference of 12.4%), Hmong (13.7%, a difference of 20.0%), Lumbee (13.5%, a difference of 22.5%), and Tlingit-Haida (20.7%, a difference of 25.8%).
| Demographics | Rating | Rank | Unemployment Among Seniors over 75 years |
| Alaskan Athabascans | 0.0 /100 | #333 | Tragic 11.0% |
| Assyrians/Chaldeans/Syriacs | 0.0 /100 | #334 | Tragic 11.1% |
| French Canadians | 0.0 /100 | #335 | Tragic 11.2% |
| Immigrants | North Macedonia | 0.0 /100 | #336 | Tragic 11.3% |
| Cape Verdeans | 0.0 /100 | #337 | Tragic 11.4% |
| Immigrants | Cabo Verde | 0.0 /100 | #338 | Tragic 12.3% |
| Cajuns | 0.0 /100 | #339 | Tragic 12.5% |
| Yup'ik | 0.0 /100 | #340 | Tragic 12.8% |
| Lumbee | 0.0 /100 | #341 | Tragic 13.5% |
| Hmong | 0.0 /100 | #342 | Tragic 13.7% |
| Alaska Natives | 0.0 /100 | #343 | Tragic 14.7% |
| Immigrants | Yemen | 0.0 /100 | #344 | Tragic 16.5% |
| Yakama | 0.0 /100 | #345 | Tragic 18.4% |
| Tlingit-Haida | 0.0 /100 | #346 | Tragic 20.7% |
Demographics Similar to Immigrants from Western Asia by Unemployment Among Seniors over 75 years
In terms of unemployment among seniors over 75 years, the demographic groups most similar to Immigrants from Western Asia are Immigrants from Oceania (9.0%, a difference of 0.080%), Immigrants from Brazil (9.0%, a difference of 0.090%), Immigrants from Latin America (9.0%, a difference of 0.11%), Romanian (9.0%, a difference of 0.15%), and Lebanese (9.0%, a difference of 0.18%).
| Demographics | Rating | Rank | Unemployment Among Seniors over 75 years |
| Immigrants | Philippines | 15.8 /100 | #208 | Poor 8.9% |
| Salvadorans | 15.4 /100 | #209 | Poor 8.9% |
| Bermudans | 15.0 /100 | #210 | Poor 8.9% |
| Delaware | 14.6 /100 | #211 | Poor 9.0% |
| Romanians | 13.8 /100 | #212 | Poor 9.0% |
| Immigrants | Latin America | 13.4 /100 | #213 | Poor 9.0% |
| Immigrants | Brazil | 13.3 /100 | #214 | Poor 9.0% |
| Immigrants | Western Asia | 12.5 /100 | #215 | Poor 9.0% |
| Immigrants | Oceania | 11.8 /100 | #216 | Poor 9.0% |
| Lebanese | 11.1 /100 | #217 | Poor 9.0% |
| Immigrants | Africa | 9.7 /100 | #218 | Tragic 9.0% |
| Afghans | 8.3 /100 | #219 | Tragic 9.0% |
| Immigrants | Zimbabwe | 7.8 /100 | #220 | Tragic 9.0% |
| Guamanians/Chamorros | 7.7 /100 | #221 | Tragic 9.0% |
| Peruvians | 7.3 /100 | #222 | Tragic 9.0% |