Immigrants from West Indies vs Ugandan Single Female Poverty
COMPARE
Immigrants from West Indies
Ugandan
Single Female Poverty
Single Female Poverty Comparison
Immigrants from West Indies
Ugandans
22.5%
SINGLE FEMALE POVERTY
1.0/ 100
METRIC RATING
251st/ 347
METRIC RANK
20.8%
SINGLE FEMALE POVERTY
64.0/ 100
METRIC RATING
165th/ 347
METRIC RANK
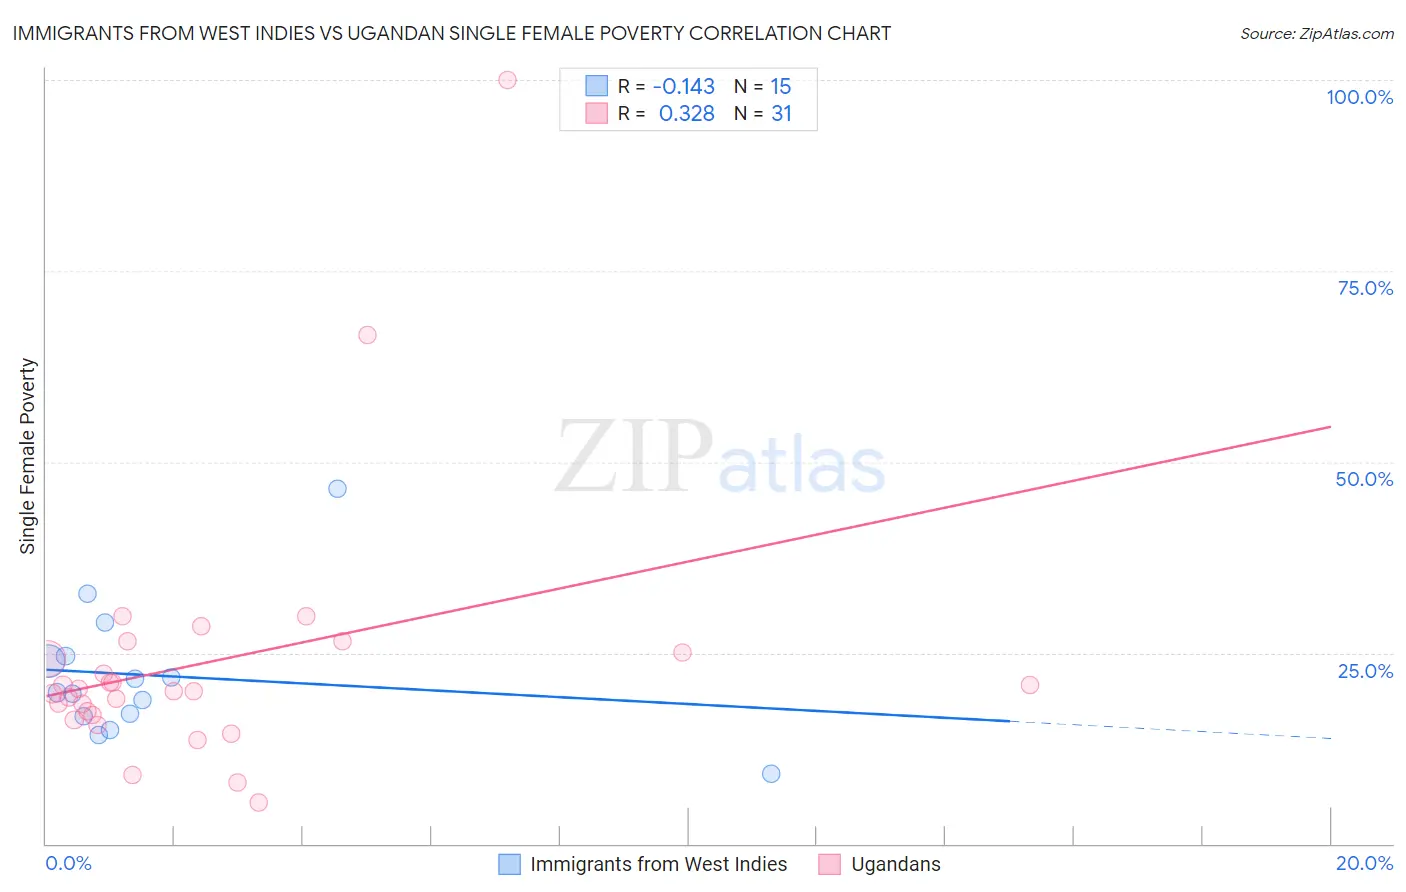
Immigrants from West Indies vs Ugandan Single Female Poverty Correlation Chart
The statistical analysis conducted on geographies consisting of 72,360,150 people shows a poor negative correlation between the proportion of Immigrants from West Indies and poverty level among single females in the United States with a correlation coefficient (R) of -0.143 and weighted average of 22.5%. Similarly, the statistical analysis conducted on geographies consisting of 93,803,349 people shows a mild positive correlation between the proportion of Ugandans and poverty level among single females in the United States with a correlation coefficient (R) of 0.328 and weighted average of 20.8%, a difference of 8.0%.
Single Female Poverty Correlation Summary
| Measurement | Immigrants from West Indies | Ugandan |
| Minimum | 9.1% | 5.5% |
| Maximum | 46.4% | 100.0% |
| Range | 37.3% | 94.5% |
| Mean | 22.0% | 23.7% |
| Median | 19.7% | 20.0% |
| Interquartile 25% (IQ1) | 16.7% | 16.9% |
| Interquartile 75% (IQ3) | 24.5% | 25.0% |
| Interquartile Range (IQR) | 7.8% | 8.1% |
| Standard Deviation (Sample) | 9.0% | 17.5% |
| Standard Deviation (Population) | 8.7% | 17.2% |
Similar Demographics by Single Female Poverty
Demographics Similar to Immigrants from West Indies by Single Female Poverty
In terms of single female poverty, the demographic groups most similar to Immigrants from West Indies are Delaware (22.5%, a difference of 0.11%), Immigrants from Bahamas (22.5%, a difference of 0.14%), Immigrants from Liberia (22.5%, a difference of 0.20%), Immigrants from Caribbean (22.4%, a difference of 0.29%), and Immigrants from Burma/Myanmar (22.6%, a difference of 0.30%).
| Demographics | Rating | Rank | Single Female Poverty |
| Immigrants | Middle Africa | 1.9 /100 | #244 | Tragic 22.3% |
| Immigrants | Bangladesh | 1.8 /100 | #245 | Tragic 22.3% |
| Liberians | 1.4 /100 | #246 | Tragic 22.4% |
| Immigrants | El Salvador | 1.4 /100 | #247 | Tragic 22.4% |
| Belizeans | 1.4 /100 | #248 | Tragic 22.4% |
| Immigrants | Caribbean | 1.3 /100 | #249 | Tragic 22.4% |
| Immigrants | Bahamas | 1.2 /100 | #250 | Tragic 22.5% |
| Immigrants | West Indies | 1.0 /100 | #251 | Tragic 22.5% |
| Delaware | 1.0 /100 | #252 | Tragic 22.5% |
| Immigrants | Liberia | 0.9 /100 | #253 | Tragic 22.5% |
| Immigrants | Burma/Myanmar | 0.8 /100 | #254 | Tragic 22.6% |
| Immigrants | Sudan | 0.8 /100 | #255 | Tragic 22.6% |
| Immigrants | Belize | 0.8 /100 | #256 | Tragic 22.6% |
| Sudanese | 0.7 /100 | #257 | Tragic 22.6% |
| Bahamians | 0.6 /100 | #258 | Tragic 22.7% |
Demographics Similar to Ugandans by Single Female Poverty
In terms of single female poverty, the demographic groups most similar to Ugandans are Iraqi (20.8%, a difference of 0.040%), Norwegian (20.8%, a difference of 0.060%), Immigrants from Norway (20.8%, a difference of 0.070%), Immigrants from Costa Rica (20.9%, a difference of 0.16%), and Lebanese (20.8%, a difference of 0.26%).
| Demographics | Rating | Rank | Single Female Poverty |
| Danes | 73.0 /100 | #158 | Good 20.7% |
| Costa Ricans | 71.8 /100 | #159 | Good 20.7% |
| Arabs | 70.8 /100 | #160 | Good 20.7% |
| Kenyans | 68.5 /100 | #161 | Good 20.8% |
| Northern Europeans | 68.4 /100 | #162 | Good 20.8% |
| Lebanese | 67.6 /100 | #163 | Good 20.8% |
| Iraqis | 64.5 /100 | #164 | Good 20.8% |
| Ugandans | 64.0 /100 | #165 | Good 20.8% |
| Norwegians | 63.0 /100 | #166 | Good 20.8% |
| Immigrants | Norway | 63.0 /100 | #167 | Good 20.8% |
| Immigrants | Costa Rica | 61.5 /100 | #168 | Good 20.9% |
| Immigrants | Trinidad and Tobago | 56.3 /100 | #169 | Average 20.9% |
| New Zealanders | 53.2 /100 | #170 | Average 21.0% |
| Moroccans | 52.8 /100 | #171 | Average 21.0% |
| Guyanese | 52.0 /100 | #172 | Average 21.0% |