Immigrants from West Indies vs Japanese Single Female Poverty
COMPARE
Immigrants from West Indies
Japanese
Single Female Poverty
Single Female Poverty Comparison
Immigrants from West Indies
Japanese
22.5%
SINGLE FEMALE POVERTY
1.0/ 100
METRIC RATING
251st/ 347
METRIC RANK
21.3%
SINGLE FEMALE POVERTY
26.4/ 100
METRIC RATING
197th/ 347
METRIC RANK
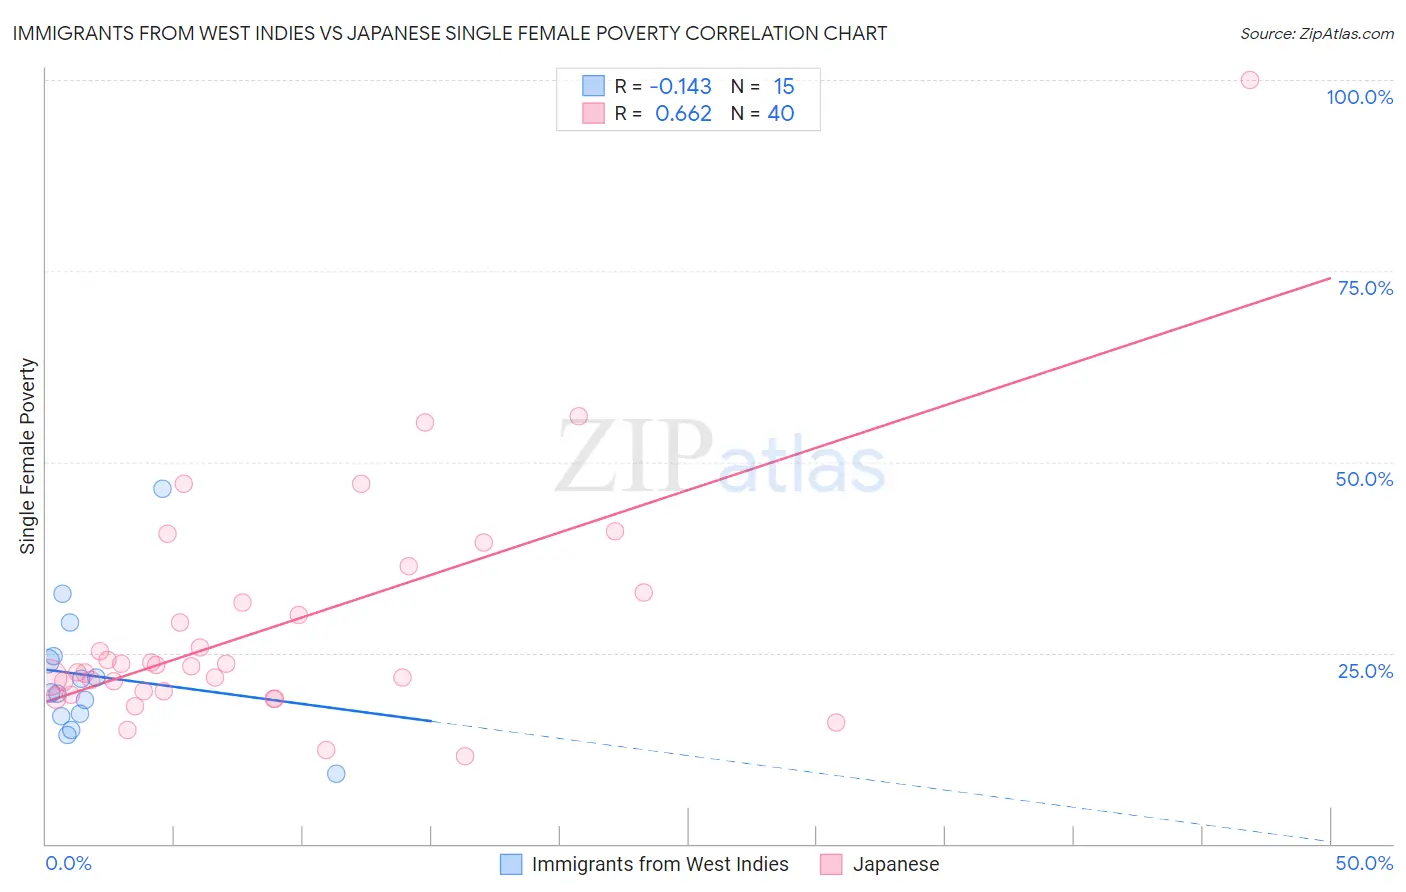
Immigrants from West Indies vs Japanese Single Female Poverty Correlation Chart
The statistical analysis conducted on geographies consisting of 72,360,150 people shows a poor negative correlation between the proportion of Immigrants from West Indies and poverty level among single females in the United States with a correlation coefficient (R) of -0.143 and weighted average of 22.5%. Similarly, the statistical analysis conducted on geographies consisting of 247,508,626 people shows a significant positive correlation between the proportion of Japanese and poverty level among single females in the United States with a correlation coefficient (R) of 0.662 and weighted average of 21.3%, a difference of 5.4%.
Single Female Poverty Correlation Summary
| Measurement | Immigrants from West Indies | Japanese |
| Minimum | 9.1% | 11.5% |
| Maximum | 46.4% | 100.0% |
| Range | 37.3% | 88.5% |
| Mean | 22.0% | 28.5% |
| Median | 19.7% | 23.4% |
| Interquartile 25% (IQ1) | 16.7% | 19.9% |
| Interquartile 75% (IQ3) | 24.5% | 32.3% |
| Interquartile Range (IQR) | 7.8% | 12.3% |
| Standard Deviation (Sample) | 9.0% | 15.9% |
| Standard Deviation (Population) | 8.7% | 15.7% |
Similar Demographics by Single Female Poverty
Demographics Similar to Immigrants from West Indies by Single Female Poverty
In terms of single female poverty, the demographic groups most similar to Immigrants from West Indies are Delaware (22.5%, a difference of 0.11%), Immigrants from Bahamas (22.5%, a difference of 0.14%), Immigrants from Liberia (22.5%, a difference of 0.20%), Immigrants from Caribbean (22.4%, a difference of 0.29%), and Immigrants from Burma/Myanmar (22.6%, a difference of 0.30%).
| Demographics | Rating | Rank | Single Female Poverty |
| Immigrants | Middle Africa | 1.9 /100 | #244 | Tragic 22.3% |
| Immigrants | Bangladesh | 1.8 /100 | #245 | Tragic 22.3% |
| Liberians | 1.4 /100 | #246 | Tragic 22.4% |
| Immigrants | El Salvador | 1.4 /100 | #247 | Tragic 22.4% |
| Belizeans | 1.4 /100 | #248 | Tragic 22.4% |
| Immigrants | Caribbean | 1.3 /100 | #249 | Tragic 22.4% |
| Immigrants | Bahamas | 1.2 /100 | #250 | Tragic 22.5% |
| Immigrants | West Indies | 1.0 /100 | #251 | Tragic 22.5% |
| Delaware | 1.0 /100 | #252 | Tragic 22.5% |
| Immigrants | Liberia | 0.9 /100 | #253 | Tragic 22.5% |
| Immigrants | Burma/Myanmar | 0.8 /100 | #254 | Tragic 22.6% |
| Immigrants | Sudan | 0.8 /100 | #255 | Tragic 22.6% |
| Immigrants | Belize | 0.8 /100 | #256 | Tragic 22.6% |
| Sudanese | 0.7 /100 | #257 | Tragic 22.6% |
| Bahamians | 0.6 /100 | #258 | Tragic 22.7% |
Demographics Similar to Japanese by Single Female Poverty
In terms of single female poverty, the demographic groups most similar to Japanese are Immigrants from Saudi Arabia (21.3%, a difference of 0.060%), Nicaraguan (21.3%, a difference of 0.090%), Czechoslovakian (21.3%, a difference of 0.10%), Basque (21.3%, a difference of 0.13%), and Swiss (21.4%, a difference of 0.17%).
| Demographics | Rating | Rank | Single Female Poverty |
| Trinidadians and Tobagonians | 35.2 /100 | #190 | Fair 21.2% |
| Immigrants | Germany | 31.1 /100 | #191 | Fair 21.3% |
| Immigrants | Jamaica | 30.5 /100 | #192 | Fair 21.3% |
| Basques | 28.1 /100 | #193 | Fair 21.3% |
| Czechoslovakians | 27.7 /100 | #194 | Fair 21.3% |
| Nicaraguans | 27.6 /100 | #195 | Fair 21.3% |
| Immigrants | Saudi Arabia | 27.1 /100 | #196 | Fair 21.3% |
| Japanese | 26.4 /100 | #197 | Fair 21.3% |
| Swiss | 24.2 /100 | #198 | Fair 21.4% |
| Immigrants | Immigrants | 22.0 /100 | #199 | Fair 21.4% |
| Irish | 21.4 /100 | #200 | Fair 21.4% |
| Nigerians | 20.9 /100 | #201 | Fair 21.4% |
| Immigrants | Kenya | 20.7 /100 | #202 | Fair 21.4% |
| Immigrants | Haiti | 18.8 /100 | #203 | Poor 21.5% |
| Immigrants | Africa | 16.7 /100 | #204 | Poor 21.5% |