Immigrants from Vietnam vs Filipino Single Female Poverty
COMPARE
Immigrants from Vietnam
Filipino
Single Female Poverty
Single Female Poverty Comparison
Immigrants from Vietnam
Filipinos
19.1%
SINGLE FEMALE POVERTY
99.7/ 100
METRIC RATING
55th/ 347
METRIC RANK
17.0%
SINGLE FEMALE POVERTY
100.0/ 100
METRIC RATING
6th/ 347
METRIC RANK
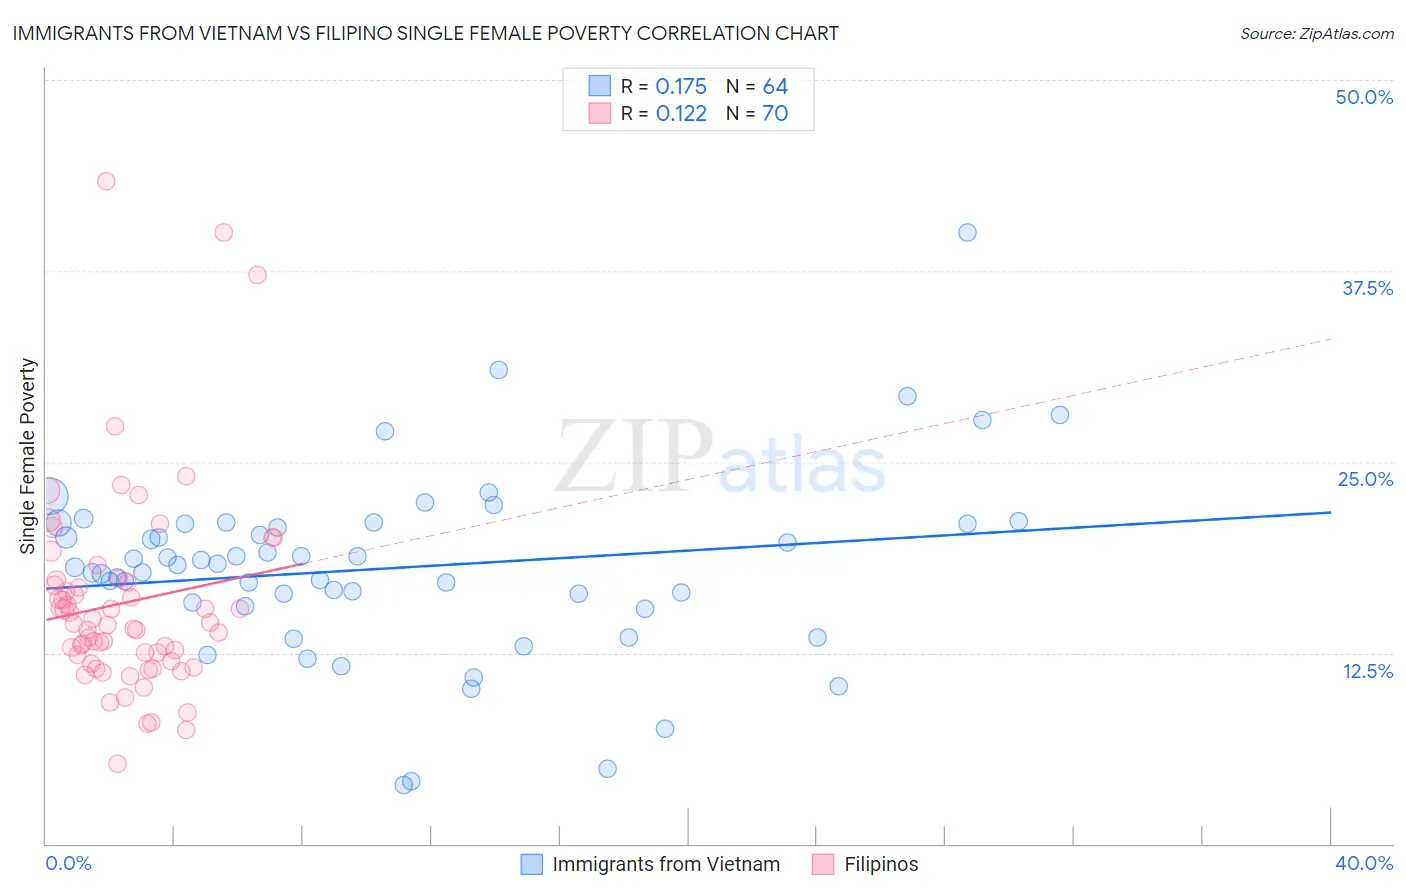
Immigrants from Vietnam vs Filipino Single Female Poverty Correlation Chart
The statistical analysis conducted on geographies consisting of 399,262,621 people shows a poor positive correlation between the proportion of Immigrants from Vietnam and poverty level among single females in the United States with a correlation coefficient (R) of 0.175 and weighted average of 19.1%. Similarly, the statistical analysis conducted on geographies consisting of 251,336,668 people shows a poor positive correlation between the proportion of Filipinos and poverty level among single females in the United States with a correlation coefficient (R) of 0.122 and weighted average of 17.0%, a difference of 12.5%.
Single Female Poverty Correlation Summary
| Measurement | Immigrants from Vietnam | Filipino |
| Minimum | 3.8% | 5.2% |
| Maximum | 40.0% | 43.4% |
| Range | 36.2% | 38.2% |
| Mean | 18.0% | 15.8% |
| Median | 18.2% | 14.3% |
| Interquartile 25% (IQ1) | 15.7% | 12.0% |
| Interquartile 75% (IQ3) | 20.9% | 17.1% |
| Interquartile Range (IQR) | 5.3% | 5.1% |
| Standard Deviation (Sample) | 6.1% | 6.7% |
| Standard Deviation (Population) | 6.0% | 6.7% |
Similar Demographics by Single Female Poverty
Demographics Similar to Immigrants from Vietnam by Single Female Poverty
In terms of single female poverty, the demographic groups most similar to Immigrants from Vietnam are Argentinean (19.1%, a difference of 0.040%), Tsimshian (19.1%, a difference of 0.050%), Immigrants from Fiji (19.1%, a difference of 0.050%), Eastern European (19.1%, a difference of 0.11%), and Immigrants from Bulgaria (19.1%, a difference of 0.23%).
| Demographics | Rating | Rank | Single Female Poverty |
| Immigrants | Argentina | 99.8 /100 | #48 | Exceptional 19.0% |
| Immigrants | Czechoslovakia | 99.8 /100 | #49 | Exceptional 19.0% |
| Immigrants | Eastern Europe | 99.8 /100 | #50 | Exceptional 19.0% |
| Immigrants | Italy | 99.8 /100 | #51 | Exceptional 19.0% |
| Egyptians | 99.7 /100 | #52 | Exceptional 19.1% |
| Tsimshian | 99.7 /100 | #53 | Exceptional 19.1% |
| Argentineans | 99.7 /100 | #54 | Exceptional 19.1% |
| Immigrants | Vietnam | 99.7 /100 | #55 | Exceptional 19.1% |
| Immigrants | Fiji | 99.7 /100 | #56 | Exceptional 19.1% |
| Eastern Europeans | 99.7 /100 | #57 | Exceptional 19.1% |
| Immigrants | Bulgaria | 99.7 /100 | #58 | Exceptional 19.1% |
| Sri Lankans | 99.6 /100 | #59 | Exceptional 19.2% |
| Russians | 99.6 /100 | #60 | Exceptional 19.2% |
| Cambodians | 99.6 /100 | #61 | Exceptional 19.2% |
| Lithuanians | 99.6 /100 | #62 | Exceptional 19.2% |
Demographics Similar to Filipinos by Single Female Poverty
In terms of single female poverty, the demographic groups most similar to Filipinos are Assyrian/Chaldean/Syriac (17.0%, a difference of 0.20%), Immigrants from India (16.8%, a difference of 1.0%), Thai (17.3%, a difference of 1.7%), Immigrants from Iran (17.5%, a difference of 2.8%), and Immigrants from Hong Kong (16.5%, a difference of 2.8%).
| Demographics | Rating | Rank | Single Female Poverty |
| Chinese | 100.0 /100 | #1 | Exceptional 16.1% |
| Immigrants | Taiwan | 100.0 /100 | #2 | Exceptional 16.4% |
| Immigrants | Hong Kong | 100.0 /100 | #3 | Exceptional 16.5% |
| Immigrants | India | 100.0 /100 | #4 | Exceptional 16.8% |
| Assyrians/Chaldeans/Syriacs | 100.0 /100 | #5 | Exceptional 17.0% |
| Filipinos | 100.0 /100 | #6 | Exceptional 17.0% |
| Thais | 100.0 /100 | #7 | Exceptional 17.3% |
| Immigrants | Iran | 100.0 /100 | #8 | Exceptional 17.5% |
| Bhutanese | 100.0 /100 | #9 | Exceptional 17.7% |
| Immigrants | Ireland | 100.0 /100 | #10 | Exceptional 17.8% |
| Immigrants | Lithuania | 100.0 /100 | #11 | Exceptional 17.8% |
| Immigrants | South Central Asia | 100.0 /100 | #12 | Exceptional 17.8% |
| Immigrants | Bolivia | 100.0 /100 | #13 | Exceptional 17.8% |
| Bolivians | 100.0 /100 | #14 | Exceptional 17.9% |
| Indians (Asian) | 100.0 /100 | #15 | Exceptional 17.9% |