Immigrants from Vietnam vs Immigrants from West Indies In Labor Force | Age 35-44
COMPARE
Immigrants from Vietnam
Immigrants from West Indies
In Labor Force | Age 35-44
In Labor Force | Age 35-44 Comparison
Immigrants from Vietnam
Immigrants from West Indies
84.2%
IN LABOR FORCE | AGE 35-44
27.4/ 100
METRIC RATING
192nd/ 347
METRIC RANK
84.3%
IN LABOR FORCE | AGE 35-44
36.4/ 100
METRIC RATING
181st/ 347
METRIC RANK
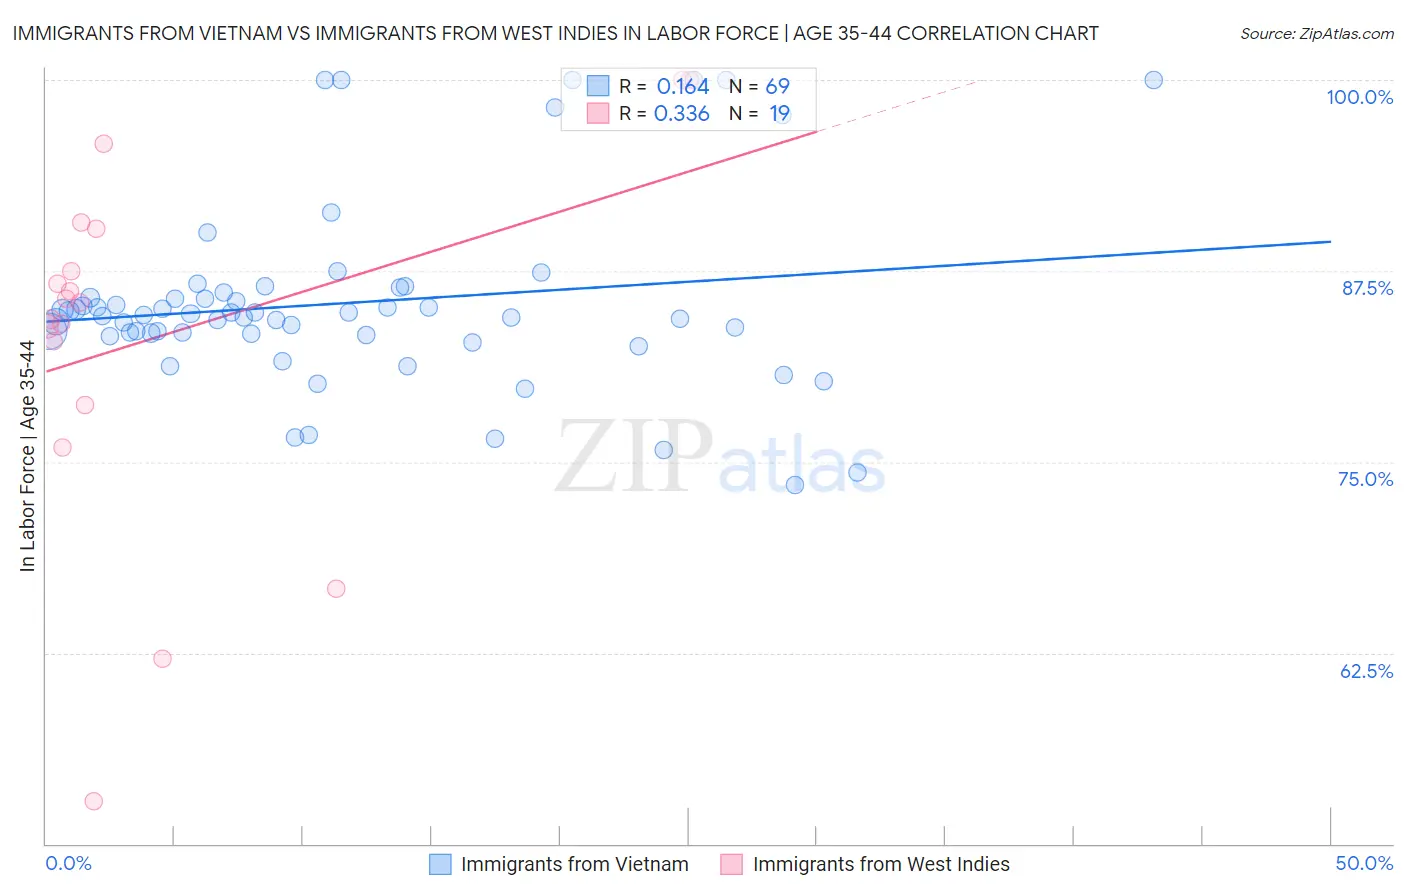
Immigrants from Vietnam vs Immigrants from West Indies In Labor Force | Age 35-44 Correlation Chart
The statistical analysis conducted on geographies consisting of 404,650,296 people shows a poor positive correlation between the proportion of Immigrants from Vietnam and labor force participation rate among population between the ages 35 and 44 in the United States with a correlation coefficient (R) of 0.164 and weighted average of 84.2%. Similarly, the statistical analysis conducted on geographies consisting of 72,456,461 people shows a mild positive correlation between the proportion of Immigrants from West Indies and labor force participation rate among population between the ages 35 and 44 in the United States with a correlation coefficient (R) of 0.336 and weighted average of 84.3%, a difference of 0.070%.
In Labor Force | Age 35-44 Correlation Summary
| Measurement | Immigrants from Vietnam | Immigrants from West Indies |
| Minimum | 73.5% | 52.8% |
| Maximum | 100.0% | 100.0% |
| Range | 26.5% | 47.2% |
| Mean | 85.4% | 83.1% |
| Median | 84.6% | 85.4% |
| Interquartile 25% (IQ1) | 83.3% | 78.7% |
| Interquartile 75% (IQ3) | 85.9% | 90.3% |
| Interquartile Range (IQR) | 2.6% | 11.6% |
| Standard Deviation (Sample) | 6.0% | 12.0% |
| Standard Deviation (Population) | 6.0% | 11.7% |
Demographics Similar to Immigrants from Vietnam and Immigrants from West Indies by In Labor Force | Age 35-44
In terms of in labor force | age 35-44, the demographic groups most similar to Immigrants from Vietnam are Immigrants from Philippines (84.2%, a difference of 0.0%), Hungarian (84.2%, a difference of 0.010%), Immigrants from Indonesia (84.2%, a difference of 0.010%), Immigrants from Caribbean (84.2%, a difference of 0.010%), and Immigrants from England (84.2%, a difference of 0.020%). Similarly, the demographic groups most similar to Immigrants from West Indies are Korean (84.3%, a difference of 0.0%), Barbadian (84.3%, a difference of 0.0%), Armenian (84.3%, a difference of 0.010%), Costa Rican (84.3%, a difference of 0.010%), and Australian (84.3%, a difference of 0.010%).
| Demographics | Rating | Rank | In Labor Force | Age 35-44 |
| Sri Lankans | 47.3 /100 | #176 | Average 84.4% |
| French Canadians | 44.3 /100 | #177 | Average 84.3% |
| Northern Europeans | 44.1 /100 | #178 | Average 84.3% |
| Immigrants | South Africa | 42.8 /100 | #179 | Average 84.3% |
| Danes | 38.8 /100 | #180 | Fair 84.3% |
| Immigrants | West Indies | 36.4 /100 | #181 | Fair 84.3% |
| Koreans | 36.3 /100 | #182 | Fair 84.3% |
| Barbadians | 36.2 /100 | #183 | Fair 84.3% |
| Armenians | 35.6 /100 | #184 | Fair 84.3% |
| Costa Ricans | 35.3 /100 | #185 | Fair 84.3% |
| Australians | 35.1 /100 | #186 | Fair 84.3% |
| Dutch | 34.8 /100 | #187 | Fair 84.3% |
| South Africans | 34.1 /100 | #188 | Fair 84.3% |
| Immigrants | Denmark | 33.7 /100 | #189 | Fair 84.3% |
| Portuguese | 31.9 /100 | #190 | Fair 84.3% |
| Immigrants | Philippines | 27.9 /100 | #191 | Fair 84.2% |
| Immigrants | Vietnam | 27.4 /100 | #192 | Fair 84.2% |
| Hungarians | 26.8 /100 | #193 | Fair 84.2% |
| Immigrants | Indonesia | 25.7 /100 | #194 | Fair 84.2% |
| Immigrants | Caribbean | 25.7 /100 | #195 | Fair 84.2% |
| Immigrants | England | 25.0 /100 | #196 | Fair 84.2% |