Immigrants from Saudi Arabia vs Immigrants from Jamaica Master's Degree
COMPARE
Immigrants from Saudi Arabia
Immigrants from Jamaica
Master's Degree
Master's Degree Comparison
Immigrants from Saudi Arabia
Immigrants from Jamaica
19.0%
MASTER'S DEGREE
100.0/ 100
METRIC RATING
42nd/ 347
METRIC RANK
13.0%
MASTER'S DEGREE
1.9/ 100
METRIC RATING
243rd/ 347
METRIC RANK
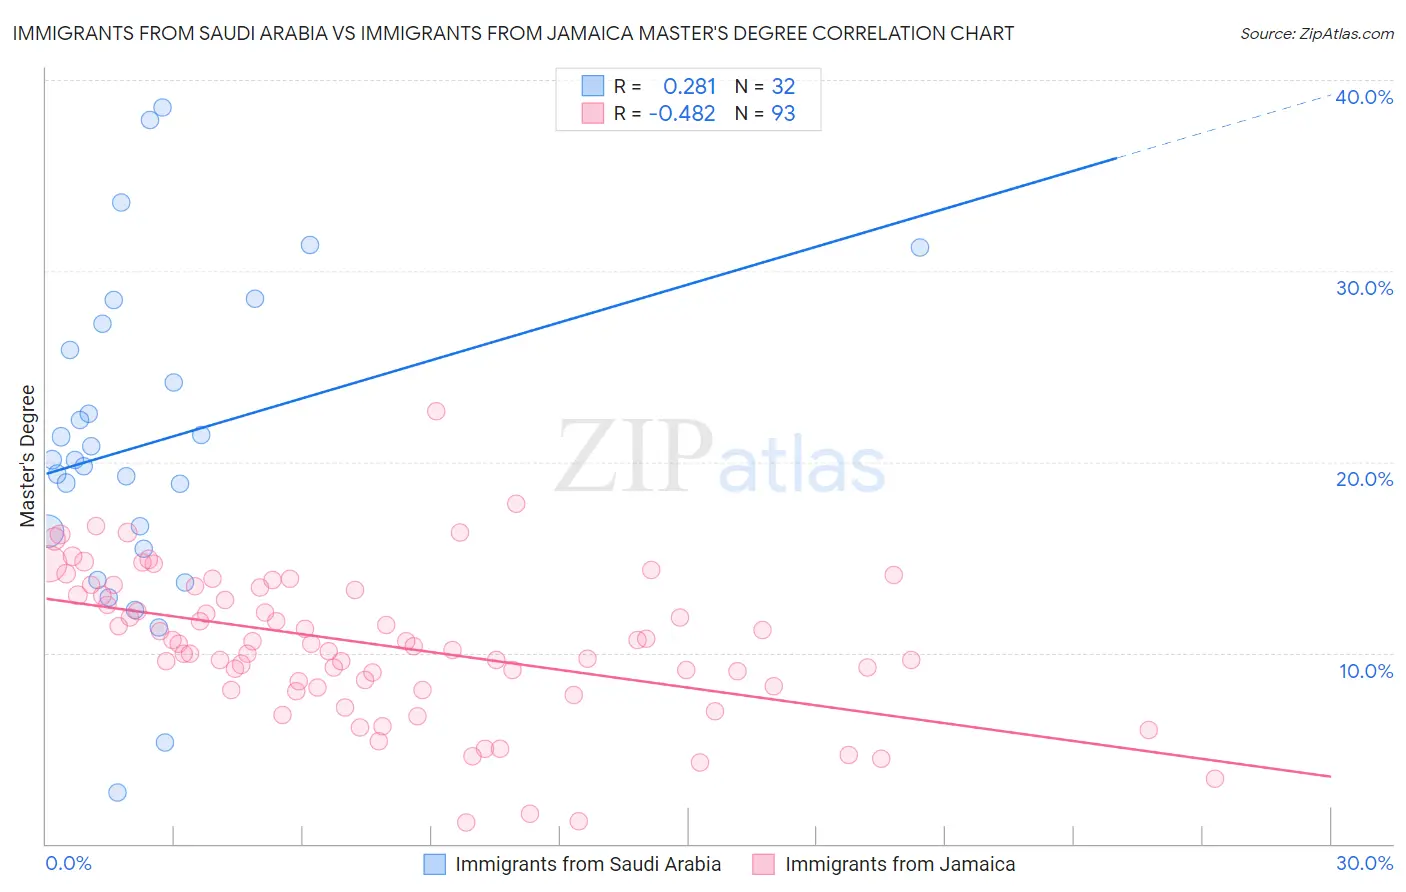
Immigrants from Saudi Arabia vs Immigrants from Jamaica Master's Degree Correlation Chart
The statistical analysis conducted on geographies consisting of 164,258,761 people shows a weak positive correlation between the proportion of Immigrants from Saudi Arabia and percentage of population with at least master's degree education in the United States with a correlation coefficient (R) of 0.281 and weighted average of 19.0%. Similarly, the statistical analysis conducted on geographies consisting of 301,740,066 people shows a moderate negative correlation between the proportion of Immigrants from Jamaica and percentage of population with at least master's degree education in the United States with a correlation coefficient (R) of -0.482 and weighted average of 13.0%, a difference of 45.5%.
Master's Degree Correlation Summary
| Measurement | Immigrants from Saudi Arabia | Immigrants from Jamaica |
| Minimum | 2.7% | 1.1% |
| Maximum | 38.6% | 22.6% |
| Range | 35.9% | 21.5% |
| Mean | 21.0% | 10.4% |
| Median | 20.1% | 10.5% |
| Interquartile 25% (IQ1) | 15.9% | 8.2% |
| Interquartile 75% (IQ3) | 26.6% | 13.3% |
| Interquartile Range (IQR) | 10.6% | 5.1% |
| Standard Deviation (Sample) | 8.4% | 3.8% |
| Standard Deviation (Population) | 8.2% | 3.8% |
Similar Demographics by Master's Degree
Demographics Similar to Immigrants from Saudi Arabia by Master's Degree
In terms of master's degree, the demographic groups most similar to Immigrants from Saudi Arabia are Immigrants from Greece (19.0%, a difference of 0.010%), Immigrants from Malaysia (18.9%, a difference of 0.29%), Immigrants from Belarus (18.9%, a difference of 0.40%), Immigrants from Latvia (19.1%, a difference of 0.43%), and Immigrants from Bolivia (19.1%, a difference of 0.78%).
| Demographics | Rating | Rank | Master's Degree |
| Immigrants | Northern Europe | 100.0 /100 | #35 | Exceptional 19.5% |
| Immigrants | Russia | 100.0 /100 | #36 | Exceptional 19.4% |
| Mongolians | 100.0 /100 | #37 | Exceptional 19.4% |
| Bolivians | 100.0 /100 | #38 | Exceptional 19.3% |
| Immigrants | Spain | 100.0 /100 | #39 | Exceptional 19.1% |
| Immigrants | Bolivia | 100.0 /100 | #40 | Exceptional 19.1% |
| Immigrants | Latvia | 100.0 /100 | #41 | Exceptional 19.1% |
| Immigrants | Saudi Arabia | 100.0 /100 | #42 | Exceptional 19.0% |
| Immigrants | Greece | 100.0 /100 | #43 | Exceptional 19.0% |
| Immigrants | Malaysia | 100.0 /100 | #44 | Exceptional 18.9% |
| Immigrants | Belarus | 100.0 /100 | #45 | Exceptional 18.9% |
| Immigrants | Norway | 100.0 /100 | #46 | Exceptional 18.8% |
| Immigrants | Austria | 100.0 /100 | #47 | Exceptional 18.8% |
| Paraguayans | 100.0 /100 | #48 | Exceptional 18.8% |
| Estonians | 100.0 /100 | #49 | Exceptional 18.8% |
Demographics Similar to Immigrants from Jamaica by Master's Degree
In terms of master's degree, the demographic groups most similar to Immigrants from Jamaica are Spanish American (13.0%, a difference of 0.040%), U.S. Virgin Islander (13.1%, a difference of 0.32%), Delaware (13.0%, a difference of 0.38%), Guamanian/Chamorro (13.1%, a difference of 0.47%), and Immigrants from Bahamas (12.9%, a difference of 1.0%).
| Demographics | Rating | Rank | Master's Degree |
| Immigrants | Guyana | 4.4 /100 | #236 | Tragic 13.4% |
| Jamaicans | 4.1 /100 | #237 | Tragic 13.4% |
| Hmong | 4.0 /100 | #238 | Tragic 13.4% |
| Immigrants | Nonimmigrants | 3.4 /100 | #239 | Tragic 13.3% |
| Guamanians/Chamorros | 2.2 /100 | #240 | Tragic 13.1% |
| U.S. Virgin Islanders | 2.1 /100 | #241 | Tragic 13.1% |
| Spanish Americans | 1.9 /100 | #242 | Tragic 13.0% |
| Immigrants | Jamaica | 1.9 /100 | #243 | Tragic 13.0% |
| Delaware | 1.7 /100 | #244 | Tragic 13.0% |
| Immigrants | Bahamas | 1.4 /100 | #245 | Tragic 12.9% |
| Immigrants | Cambodia | 1.4 /100 | #246 | Tragic 12.9% |
| Iroquois | 1.4 /100 | #247 | Tragic 12.9% |
| Africans | 1.4 /100 | #248 | Tragic 12.9% |
| Cree | 1.3 /100 | #249 | Tragic 12.8% |
| Liberians | 1.3 /100 | #250 | Tragic 12.8% |